[solved]VLINE not showing the last plot value on the tooltip
I have a VLINE chart which shows the data for 12 months. The chart is working good but when I do mouse over to see the data value on tooltip it is not showing for the last plot.
For ex: If the graph shows the data from Jan to Dec, the tooltip is not showing the data for Dec.
How can I get that value displayed?
Sample Code: In the attached sample code, if you see the chart it won't show the tooltip data value for November.
DEFINE FILE GGSALES DISPMON/A3=IF ST EQ 'CA' THEN 'Jan' ELSE IF ST EQ 'CT' THEN 'Feb' ELSE IF ST EQ 'FL' THEN 'Mar' ELSE IF ST EQ 'GA' THEN 'Apr' ELSE IF ST EQ 'IL' THEN 'May' ELSE IF ST EQ 'MA' THEN 'Jun' ELSE IF ST EQ 'MO' THEN 'Jul' ELSE IF ST EQ 'NY' THEN 'Aug' ELSE IF ST EQ 'TN' THEN 'Sep' ELSE IF ST EQ 'TX' THEN 'Oct' ELSE IF ST EQ 'WA' THEN 'Nov' ELSE 'Dec'; DISPMON2/I2=IF DISPMON EQ 'Jan' THEN 1 ELSE IF DISPMON EQ 'Feb' THEN 2 ELSE IF DISPMON EQ 'Mar' THEN 3 ELSE IF DISPMON EQ 'Apr' THEN 4 ELSE IF DISPMON EQ 'May' THEN 5 ELSE IF DISPMON EQ 'Jun' THEN 6 ELSE IF DISPMON EQ 'Jul' THEN 7 ELSE IF DISPMON EQ 'Aug' THEN 8 ELSE IF DISPMON EQ 'Sep' THEN 9 ELSE IF DISPMON EQ 'Oct' THEN 10 ELSE IF DISPMON EQ 'Nov' THEN 11 ELSE IF DISPMON EQ 'Dec' THEN 12 ELSE 0;
PRODCNT/I5=IF ST EQ LAST ST THEN 1 ELSE PRODCNT + 1; END
SET HAXIS=500 SET VAXIS=150 SET LOOKGRAPH=VLINE SET GRMERGE=ON SET 3D=OFF GRAPH FILE GGSALES SUM PRODCNT AS '' BY DISPMON2 NOPRINT BY DISPMON AS '' ON TABLE SET STYLE * TYPE=REPORT,SIZE=9,FONT='ARIAL',GRID=OFF,$ ENDSTYLE ON GRAPH SET GRAPHEDIT SERVER ON GRAPH SET BARNUMB OFF ON GRAPH SET VZERO OFF ON GRAPH SET GRID OFF ON GRAPH SET GRAPHSTYLE * setPlace(true); setSubtitleString("New Submitted"); setTextJustHoriz(getSubtitle(),0); setFontSizeAbsolute(getSubtitle(),true); setFontSize(getSubtitle(),15); setFillColor(getChartBackground(), new Color(255,255,255)); setO1AxisSide(1); setFrameDisplay(false); setLegendDisplay(false); setDisplay(getO1MajorGrid(),false); setMarkerSize(getSeries(0),0); setMarkerSize(getSeries(1),0); setPlace(false); ENDSTYLE END -EXIT
Thanks for your help.This message has been edited. Last edited by: Kamesh,
WFConsultant
WF 8105M on Win7/Tomcat
June 11, 2013, 11:16 AM
Doug
Did you do this using the GUI? If not, why not?
I moved some stuff around, as follows, and it seems to work:
END
-*SET HAXIS=500
-*SET VAXIS=150
-*SET LOOKGRAPH=VLINE
-*SET GRMERGE=ON
SET 3D=OFF
GRAPH FILE GGSALES
SUM
PRODCNT AS ''
BY DISPMON2 NOPRINT
BY DISPMON AS ''
ON GRAPH SET HAXIS 500
ON GRAPH SET VAXIS 150
ON GRAPH SET LOOKGRAPH VLINE
ON GRAPH SET GRMERGE ON
ON GRAPH SET GRAPHEDIT SERVER
ON GRAPH SET BARNUMB OFF
ON GRAPH SET VZERO OFF
ON GRAPH SET GRID OFF
ON GRAPH SET STYLE *
TYPE=REPORT,SIZE=9,FONT='ARIAL',GRID=OFF,$
In FOCUS Since 1983 ~ from FOCUS to WebFOCUS. Current: WebFOCUS Administrator at FIS Worldpay | 8204, 8206
June 11, 2013, 01:57 PM
Kamesh
Doug,
I need to do some manipulation on the data, that's why I didn't use the GUI but if I get any question or issues, I will go to GUI to test it by using the samples.
If you have the connectmarkers to TRUE then you can see the plot for last value but we don't want to show the connect markers. If you add my graph properties on your sample, then you will get the same result as I get.
I'm experiencing the exact same issue, but for me adding the three lines provided by badri did not help: the last value still doesn't show.
I'm using the following script:
 ON GRAPH SET HTMLENCODE ON
ON GRAPH SET GRAPHDEFAULT OFF
ON GRAPH SET VZERO OFF
ON GRAPH SET UNITS PIXELS
ON GRAPH SET VAXIS 400
ON GRAPH SET HAXIS 750
ON GRAPH SET LOOKGRAPH VLINE
ON GRAPH SET AUTOFIT ON
ON GRAPH SET GRMERGE ADVANCED
ON GRAPH SET GRMULTIGRAPH 0
ON GRAPH SET GRLEGEND 0
ON GRAPH SET GRXAXIS 2
ON GRAPH SET GRAPHSTYLE *
setReportParsingErrors(false);
setSelectionEnableMove(true);
setPlace(true);
setDisplay(getLegendArea(), false);
setFillType(getSeries(0), 1);
setFillColor(getSeries(0), new Color(50 87 164));
setTransparentBorderColor(getChartBackground(),true);
setDepthRadius(0);
setDepthAngle(0);
setTextString(getY1Title(),"");
setFontName(getTitle(),"Arial");
setFontStyle(getTitle(),0);
setTextString(getO1Title(),"");
setFillType(getAllText(),1);
setTransparentFillColor(getAllText(),false);
setTransparentBorderColor(getFrame(),true);
setFontSizeAbsolute(getO1Label(), true);
setFontSizeInPoints(getO1Label(), 10);
setFontName(getY1Label(),"Arial");
setPlaceResize(getO1Label(), 0);
setForceSeriesAbsolute(getSeries(0),false);
setFillColor(getY1Label(),new Color(50 87 164));
setFillType(getFrame(),1);
setAxisSide(getY1Axis(),0);
setTextFormatPreset(getY1Label(),11);
setMarkerShape(getAllSeries(),0);
setCurveFitType(0,2);
setCurveFitEquationDisplay(false);
setFillColor  (getReferenceLineY1(0) ,new Color(152 167 169));
setFillColor  (getReferenceLineY1(1) ,new Color(152 167 169));
setFillColor  (getReferenceLineO1(0) ,new Color(152 167 169));
setFillColor  (getReferenceLineO1(1) ,new Color(152 167 169));
setFillColor  (getReferenceLineO1(2) ,new Color(152 167 169));
setFillColor  (getY1ZeroLine()       ,new Color(152 167 169));
setFillColor  (getO1AxisLine()       ,new Color(152 167 169));
setFillColor  (getY1Title()          ,new Color(50 87 164));
setFillColor  (getO1Label()          ,new Color(50 87 164));
setFillColor  (getO1AltFmtLabel(0)   ,new Color(152 167 169));
setBorderColor(getO1MajorGrid()      ,new Color(152 167 169));
setBorderColor(getLegendArea()       ,new Color(152 167 169));
setBorderColor(getSeries(0)          ,new Color(152 167 169));
setBorderColor(getY1AxisLine()       ,new Color(152 167 169));
setBorderColor(getY1AxisLine(0)      ,new Color(152 167 169));
setBorderColor(getO1AxisLine()       ,new Color(152 167 169));
setBorderColor(getY1MajorGrid()      ,new Color(152 167 169));
setBorderColor(getY1MajorTick()      ,new Color(152 167 169));
setBorderColor(getY1MinorGrid()      ,new Color(152 167 169));
setBorderColor(getY1MinorTick()      ,new Color(152 167 169));
setBorderColor(getReferenceLineO1(1) ,new Color(152 167 169));
setBorderColor(getReferenceLineO1(2) ,new Color(152 167 169));
setBorderColor(getO1MinorTick()      ,new Color(152 167 169));
setBorderColor(getNestedO1LabelLine(),new Color(152 167 169));
setMarkerDisplay(false);
setTransparentMarkers(true);
setTransparentMarkerSize(100);
ENDSTYLE
ON GRAPH SET STYLE *
$
TYPE=HEADING, FONT='ARIAL', LINE=1, SIZE=12, COLOR=RGB( 50  87 164), $
TYPE=HEADING, FONT='ARIAL', LINE=2, SIZE=12, COLOR=RGB(152 167 169), $
ENDSTYLE
END
WebFOCUS 8105m Windows 7, All Outputs
Member of the Benelux Usergroup
August 22, 2018, 07:26 AM
Tony A
Hi SWES,
Looks like an issue with WF 8.1.05 as it works in both 8.2.02M and 8.2.03.
T
In FOCUS since 1986
WebFOCUS Server 8.2.01M, thru 8.2.07 on Windows Svr 2008 R2
WebFOCUS App Studio 8.2.06 standalone on Windows 10
August 22, 2018, 07:39 AM
SWES
Thank you for your reply Tony!
*sigh* seems to me that easy to set up (non-coding), working (!) and 'good-looking' graphs will never go hand in hand with WebFOCUS... will need to use other software for such results now
WebFOCUS 8105m Windows 7, All Outputs
Member of the Benelux Usergroup
August 22, 2018, 07:56 AM
Tony A
Strangely, I've just tried it on a 8.1.05M install and it also works on there.
I don't have an 8.1.05 install to try it on, otherwise I would.
T
In FOCUS since 1986
WebFOCUS Server 8.2.01M, thru 8.2.07 on Windows Svr 2008 R2
WebFOCUS App Studio 8.2.06 standalone on Windows 10
August 22, 2018, 08:04 AM
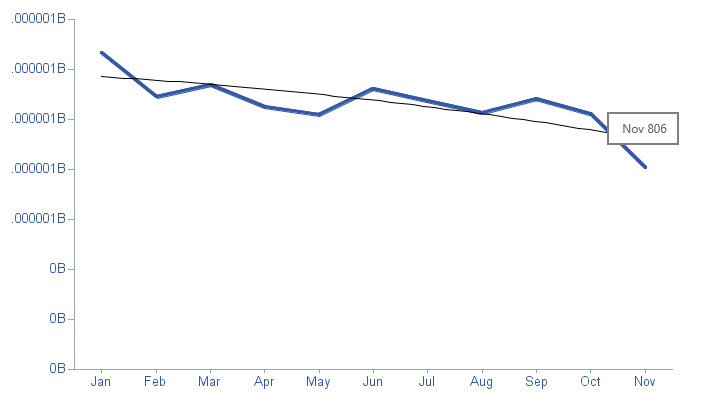
Tony A
This is what I see in all three versions that I've mentioned.
T
In FOCUS since 1986
WebFOCUS Server 8.2.01M, thru 8.2.07 on Windows Svr 2008 R2
WebFOCUS App Studio 8.2.06 standalone on Windows 10
August 22, 2018, 08:05 AM
SWES
I have 8.1.05M installed too... What would make the difference where yours is working and mine not
WebFOCUS 8105m Windows 7, All Outputs
Member of the Benelux Usergroup
August 22, 2018, 08:13 AM
Tony A
Hmmm, not sure!
Years ago there used to be an issue that depended where you positioned the mouse for the hover to be triggered. I guess it's always been a question of "where does the change point occur for tooltips?). If I remember correctly (no certainty of that now-a-days ) it occured closer to the latter data point.
It looks as though the trigger point is about 3/4s the distance between the data points.
T
In FOCUS since 1986
WebFOCUS Server 8.2.01M, thru 8.2.07 on Windows Svr 2008 R2
WebFOCUS App Studio 8.2.06 standalone on Windows 10