 |
|||||
|
As of December 1, 2020, Focal Point is retired and repurposed as a reference repository. We value the wealth of knowledge that's been shared here over the years. You'll continue to have access to this treasure trove of knowledge, for search purposes only. Join the TIBCO Community
Former myibi community members should have received an email on 8/3/22 to activate their user accounts to join the community. Check your Spam folder for the email. Please get in touch with us at community@tibco.com for further assistance. Reference the community FAQ to learn more about the community. | |||||
 Read-Only Topic
Go | Search | Notify | Tools |
| [SOLVED] Horizontal Graph Layout | Login/Join |
| Member |
I have been trying to create a horizontal graph with out any background grid and data values next to each bar. Can anyone suggest me how I can only show the Y-Axis and its horizontal Bars. Right now our graph looks like in this link: Horizontal Frquency Bar graph (last) http://online.morainevalley.ed...oject_united_way.htm We would like to see it as shown in this link: http://www.aip.de/~weber/doc/j...ame_horizbarex1.html we are using the following code: " ON GRAPH HOLD AS SSGRAPH FORMAT SVG ON GRAPH SET VZERO OFF ON GRAPH SET HTMLENCODE ON ON GRAPH SET GRAPHDEFAULT OFF ON GRAPH SET UNITS &WF_STYLE_UNITS ON GRAPH SET HAXIS &WF_STYLE_WIDTH ON GRAPH SET VAXIS &WF_STYLE_HEIGHT ON GRAPH SET GRMERGE ON -*ON GRAPH SET GRMULTIGRAPH 1 -*ON GRAPH SET GRLEGEND 0 -*ON GRAPH SET GRXAXIS 0 ON GRAPH SET LOOKGRAPH HBAR2AX ON GRAPH SET GRAPHSTYLE * setTemplateFile("/images/tdg/template/IBISouthWestern.txt"); setReportParsingErrors(false); setSelectionEnableMove(false); setTransparentBorderColor(getSeries(0),true); setTransparentBorderColor(getSeries(1),true); setTransparentBorderColor(getChartBackground(),true); setPlace(true); setDepthRadius(0); setDepthAngle(0); setTextString(getO1Title()," "); setAxisAssignment(getSeries(0),0); setAxisAssignment(getSeries(1),0); setSeriesType(getSeries(1),0); setFillColor(getSeries(0),new Color(99,142,197)); setFillColor(getSeries(1),new Color(99,142,197)); setFillColor(getSeries(2),new Color(99,142,197)); setFillColor(getSeries(3),new Color(99,142,197)); setFillColor(getSeries(4),new Color(99,142,197)); setFillColor(getSeries(5),new Color(99,142,197)); setTextString(getY1Title()," "); setDisplay(getY1Title(),true); setTitleString("Stakeholder"); setDisplay(getY1MajorGrid(),true) setGridStyle(getY1MajorGrid(),0); setDisplay(getY1MajorTick(),false); setO1MajorGridDisplay(false); setUseSeriesShapes(true); setMarkerShape(getSeries(0), 1); " Many Thanks for your supportThis message has been edited. Last edited by: <Kathryn Henning>, | ||
|
| Gold member |
Is that the Solution you are looking for?: WebFOCUS 7.6, 7.7 Windows, All Output formats | |||
|
| Member |
Dear Michael, Thank you for your inputs, but unfortuntaly, i am not looking your solution. Please have alook at the blow link, which is exact style iam looking for, Check UNIT 1 graph layout http://www.graphomate.com/en/m...ic-presentation.html Many Thanks once again WebFOCUS 8.004 Unix, PDF | |||
|
| Expert |
So, you've currently got this -  but you want this (with no lower axis) - 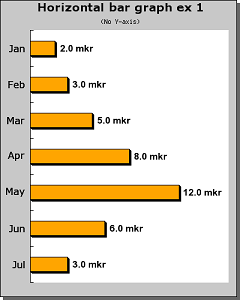 If so then Michael gave the answer within his code (there may be other code that you need) - setY1LabelDisplay(false); setY1MajorGridDisplay(false); setY1MinorGridDisplay(false); If this is not what you are after then please be a little more descriptive such as "I need to produce a horizontal bar chart with only the axis showing, plus two series of data, each shown as a bar but overlapping each other. I also need to show data values appearing at the end of the horizontal bars" etc. etc. etc. Hopefully we can then try and assist you TThis message has been edited. Last edited by: Tony A,
| |||||||||
|
| Expert |
... also, how are you coding this? Manually or using the GUI? T
| |||||||||
|
| Member |
Dear Tony, Thank you for your feedback. I am using code only (without GUI) I could able to solve some of my issues: -No Lower axis display -Data display next to the bar -Major Grid disable But now I couldnt able to remove the boarder of the graph. I tried to use the GUI to change the boarder color white, but report does not let it happen. Can anyone have any suggestion how to remove the boarders. Many thanks for your support WebFOCUS 8.004 Unix, PDF | |||
|
| Expert |
In the GUI, select the entire chart and then right click for context menu. Select "More Chart & Background Options" and you should find options under "Frame Edge". On holiday this week but had a call from a colleague asking me to help T | |||
|
| Member |
Dear Tony, Thank you for your support. Paul was with me and he try to call you when I show this issue to him. But Paul solved the issue now. ON GRAPH SET VZERO OFF ON GRAPH SET HTMLENCODE ON ON GRAPH SET GRAPHDEFAULT OFF ON GRAPH SET UNITS &WF_STYLE_UNITS ON GRAPH SET HAXIS &WF_STYLE_WIDTH ON GRAPH SET VAXIS &WF_STYLE_HEIGHT ON GRAPH SET GRMERGE ON ON GRAPH SET LOOKGRAPH HBAR ON GRAPH SET STYLE * *GRAPH_SCRIPT setPieDepth(0); setPieTilt(0); setDepthRadius(0); setCurveFitEquationDisplay(false); setPlace(true); *END INCLUDE=endeflt.sty,$ TYPE=REPORT, TITLETEXT='WebFOCUS Report', $ *GRAPH_SCRIPT setReportParsingErrors(false); setSelectionEnableMove(false); setTransparentBorderColor(getSeries(0),true); setTransparentBorderColor(getSeries(1),true); setTransparentBorderColor(getSeries(2),true); setTransparentBorderColor(getSeries(3),true); setTransparentBorderColor(getSeries(4),true); setTransparentBorderColor(getSeries(5),true); setTransparentBorderColor(getChartBackground(),true); setPlace(true); setDepthRadius(0); setDepthAngle(0); setTextString(getO1Title()," "); setAxisAssignment(getSeries(0),0); setAxisAssignment(getSeries(1),0); setSeriesType(getSeries(1),0); setFillColor(getSeries(0),new Color(99,142,197)); setFillColor(getSeries(1),new Color(99,142,197)); setFillColor(getSeries(2),new Color(99,142,197)); setFillColor(getSeries(3),new Color(99,142,197)); setFillColor(getSeries(4),new Color(99,142,197)); setFillColor(getSeries(5),new Color(99,142,197)); setTextString(getY1Title()," "); setDisplay(getY1Title(),true); setTitleString(" "); setDisplay(getY1MajorGrid(),false); setTransparentBorderColor(getFrame(),true); setTransparentBorderColor(getFrameSide(), true); setFillColor(getFrame(),new Color(255,255,255)); setDisplay(getO1MajorGrid(),false); setTransparentFillColor(getFrame(),true); setDisplay(getDataText(0), true); setFontName(getDataText(),"ARIAL"); setFontSizeAbsolute(getDataText(),true); setAutofit(getDataText(),false); setPlaceResize(getDataText(),0); setFontStyle(getDataText(),0); setFrameAutoShade(true); setDisplay(getY1Label(),false); setPieTilt(0); setPieDepth(0); setDepthRadius(0); setDepthAngle(0); setDisplay(getLegendArea(),false); setFontSizeInPoints(getDataText(),10); setFillColor(getChartBackground(),new Color(255,255,255,0)); setTransparentBorderColor(getChartBackground(),true); setDisplay(getY1AxisLine(),false); *END ENDSTYLE END -RUN Thank You once again. WebFOCUS 8.004 Unix, PDF | |||
|
| Member |
I better provide in CAR graph, users can undertand better by copy and paste the below code. -SET &ECHO=ALL; -*IA_GRAPH_BEGIN -*Do not delete or modify the comments below *-INTERNAL_COMMENT LINE#0$PD94bWwgdmVyc2lvbj0iMS4wIiBlbmNvZGluZz0iVVRGLTgiPz48IS0tMS4wLS0+PFJvb3QgdmVyc2lvbj0iMS4wIj4KICAgIDxPYmplY3Qgb2JqZWN0SWQ9IkNoYXJ0XzEiPgogICAgICAgIDxQcm9wZXJ0eSBuYW1lPSJMaW5rZWRTb3J0cyIgdHlwZT0iamF2YS5sYW5nLlN0cmluZyIvPgogICAgPC9PYmplY3Q+CiAgICA8T2JqZWN0IG9iamVjdElkPSJHTE9CQUwiPgogICAgICAgIDxQcm9wZXJ0eSBuYW1lPSJTYW1wbGVEYXRhIiB0eXBlPSJqYXZhLmxhbmcuQm9vbGVhbiI+ZmFsc2U8L1Byb3BlcnR5PgogICAgICAgIDxQcm9wZXJ0eSBuYW1lPSJHbG9iYWxSZWNvcmRMaW1pdCIgdHlwZT0iamF2YS5sYW5nLlN0cmluZyI+NTAwPC9Qcm9wZXJ0eT4KICAgICAgICA8UHJvcGVydHkgbmFtZT0iR2xvYmFsUnVuUmVjb3JkTGltaXQiIHR5cGU9ImphdmEubGFuZy5TdHJpbmciPjA8L1Byb3BlcnR5PgogICAgICAgIDxQcm9wZXJ0eSBuYW1lPSJmaWVsZERpc3BsYXlNb2RlIiB0eXBlPSJqYXZhLmxhbmcuU3RyaW5nIj5sYWJlbDwvUHJvcGVydHk+CiAgICAgICAgPFByb3BlcnR5IG5hbWU9InByZWZpeERpc3BsYXlNb2RlIiB0eXBlPSJqYXZhLmxhbmcuU3RyaW5nIi8+CiAgICAgICAgPFByb3BlcnR5IG5hbWU9IkFjdGl2ZV9TdHlsZV9Vc2VyX3R5cGUiIHR5cGU9ImphdmEubGFuZy5TdHJpbmciPnBvd2VyPC9Qcm9wZXJ0eT4KICAgICAgICA8UHJvcGVydHkgbmFtZT0iR2xvYmFsVmFsdWVzUGFnaW5nIiB0eXBlPSJqYXZhLmxhbmcuU3RyaW5nIj40PC9Qcm9wZXJ0eT4KICAgICAgICA8UHJvcGVydHkgbmFtZT0ibWV0YWRhdGFWaWV3QXMiIHR5cGU9Ik1hcCI+CiAgICAgICAgICAgIDxFbnRyeSBrZXk9IkNBUiIgdHlwZT0iamF2YS5sYW5nLlN0cmluZyI+TWV0YURhdGFUcmVlLlZJRVdfRElNUzwvRW50cnk+CiAgICAgICAgPC9Qcm9wZXJ0eT4KICAgICAgICA8UHJvcGVydHkgbmFtZT0iRm9jZXhlY1ByZWZlcmVuY2VzIiB0eXBlPSJNYXAiPgogICAgICAgICAgICA8RW50cnkga2V5PSJkZWZhdWx0X2NvbXBvc2VfZm9ybWF0IiB0eXBlPSJqYXZhLmxhbmcuU3RyaW5nIj5QREY8L0VudHJ5PgogICAgICAgICAgICA8RW50cnkga2V5PSJkaXNwbGF5SW50ZXJhY3RpdmVNb2RlSW5mb01pbmlQcmVmZXJlbmNlIiB0eXBlPSJqYXZhLmxhbmcuU3RyaW5nIj50cnVlPC9FbnRyeT4KICAgICAgICAgICAgPEVudHJ5IGtleT0iZGlzcGxheVF1aWNrQWNjZXNzVG9vbGJhclNhdmVJbmZvTWluaVByZWZlcmVuY2UiIHR5cGU9ImphdmEubGFuZy5TdHJpbmciPnRydWU8L0VudHJ5PgogICAgICAgICAgICA8RW50cnkga2V5PSJkaXNwbGF5RGF0YVRhYkluZm9NaW5pUHJlZmVyZW5jZSIgdHlwZT0iamF2YS5sYW5nLlN0cmluZyI+ZmFsc2U8L0VudHJ5PgogICAgICAgICAgICA8RW50cnkga2V5PSJkaXNwbGF5TGF5b3V0VGFiSW5mb01pbmlQcmVmZXJlbmNlIiB0eXBlPSJqYXZhLmxhbmcuU3RyaW5nIj5mYWxzZTwvRW50cnk+CiAgICAgICAgICAgIDxFbnRyeSBrZXk9ImRpc3BsYXlTbGljZXJzVGFiRWRpdEluZm9NaW5pUHJlZmVyZW5jZSIgdHlwZT0iamF2YS5sYW5nLlN0cmluZyI+ZmFsc2U8L0VudHJ5PgogICAgICAgICAgICA8RW50cnkga2V5PSJpbmZvQXNzaXN0TW9kZUFsbG93ZWRJbmZvTWluaVByZWZlcmVuY2UiIHR5cGU9ImphdmEubGFuZy5TdHJpbmciPmZhbHNlPC9FbnRyeT4KICAgICAgICAgICAgPEVudHJ5IGtleT0iZGlzcGxheUVkaXRNb2RlSW5mb01pbmlQcmVmZXJlbmNlIiB0eXBlPSJqYXZhLmxhbmcuU3RyaW5nIj5mYWxzZTwvRW50cnk+CiAgICAgICAgICAgIDxFbnRyeSBrZXk9ImRlZmF1bHRfcHJldmlld19wYWdlbGltaXRfbGF5b3V0IiB0eXBlPSJqYXZhLmxhbmcuU3RyaW5nIj4xPC9FbnRyeT4KICAgICAgICAgICAgPEVudHJ5IGtleT0iZXhjZWxfZm9ybWF0X3Zpc2libGUiIHR5cGU9ImphdmEubGFuZy5TdHJpbmciPnRydWU8L0VudHJ5PgogICAgICAgICAgICA8RW50cnkga2V5PSJydW5PblN0YXJ0dXBJbmZvTWluaVByZWZlcmVuY2UiIHR5cGU9ImphdmEubGFuZy5TdHJpbmciPnRydWU8L0VudHJ5PgogICAgICAgICAgICA8RW50cnkga2V5PSJkaXNwbGF5SG9tZVRhYkluZm9NaW5pUHJlZmVyZW5jZSIgdHlwZT0iamF2YS5sYW5nLlN0cmluZyI+ZmFsc2U8L0VudHJ5PgogICAgICAgICAgICA8RW50cnkga2V5PSJkZWZhdWx0X3ByZXZpZXdfcGFnZWxpbWl0IiB0eXBlPSJqYXZhLmxhbmcuU3RyaW5nIj41PC9FbnRyeT4KICAgICAgICAgICAgPEVudHJ5IGtleT0iZGlzcGxheUluc2VydFRhYkluZm9NaW5pUHJlZmVyZW5jZSIgdHlwZT0iamF2YS5sYW5nLlN0cmluZyI+ZmFsc2U8L0VudHJ5PgogICAgICAgICAgICA8RW50cnkga2V5PSJlZGl0b3JUeXBlX3Zpc2libGUiIHR5cGU9ImphdmEubGFuZy5TdHJpbmciPnRydWU8L0VudHJ5PgogICAgICAgICAgICA8RW50cnkga2V5PSJ0aGVtZXNfY29udHJvbF92aXNpYmxlIiB0eXBlPSJqYXZhLmxhbmcuU3RyaW5nIj50cnVlPC9FbnRyeT4KICAgICAgICAgICAgPEVudHJ5IGtleT0iZGlzcGxheUZvcm1hdFRhYkluZm9NaW5pUHJlZmVyZW5jZSIgdHlwZT0iamF2YS5sYW5nLlN0cmluZyI+dHJ1ZTwvRW50cnk+CiAgICAgICAgICAgIDxFbnRyeSBrZXk9ImRpc3BsYXlTZXJpZXNUYWJJbmZvTWluaVByZWZlcmVuY2UiIHR5cGU9ImphdmEubGFuZy5TdHJpbmciPmZhbHNlPC9FbnRyeT4KICAgICAgICAgICAgPEVudHJ5IGtleT0iZGlzcGxheVNsaWNlcnNUYWJJbnRlcmFjdGl2ZUluZm9NaW5pUHJlZmVyZW5jZSIgdHlwZT0iamF2YS5sYW5nLlN0cmluZyI+dHJ1ZTwvRW50cnk+CiAgICAgICAgICAgIDxFbnRyeSBrZXk9ImRpc3BsYXlSZXNvdXJjZXNGaWVsZFRhYkluZm9NaW5pUHJlZmVyZW5jZSIgdHlwZT0iamF2YS5sYW5nLlN0cmluZyI+ZmFsc2U8L0VudHJ5PgogICAgICAgIDwvUHJvcGVydHk+CiAg *-INTERNAL_COMMENT LINE#1$ICAgICAgPFByb3BlcnR5IG5hbWU9ImNhc2NhZGVOYW1lcyIgdHlwZT0iTWFwIi8+CiAgICAgICAgPFByb3BlcnR5IG5hbWU9Ik1hc3Rlcl9GaWxlcyIgdHlwZT0iU2V0Ij4KICAgICAgICAgICAgPEVudHJ5IHR5cGU9ImphdmEubGFuZy5TdHJpbmciPkNBUjwvRW50cnk+CiAgICAgICAgPC9Qcm9wZXJ0eT4KICAgICAgICA8UHJvcGVydHkgbmFtZT0iZW5hYmxlUHJldmlldyIgdHlwZT0iamF2YS5sYW5nLkJvb2xlYW4iPnRydWU8L1Byb3BlcnR5PgogICAgPC9PYmplY3Q+CjwvUm9vdD4= -*Do not delete or modify the comments above ENGINE INT CACHE SET ON -DEFAULTH &WF_STYLE_UNITS='PIXELS'; -DEFAULTH &WF_STYLE_HEIGHT='405.0'; -DEFAULTH &WF_STYLE_WIDTH='770.0'; GRAPH FILE CAR -* Created by Info Assist for Graph SUM CAR.BODY.RETAIL_COST CAR.BODY.DEALER_COST BY CAR.ORIGIN.COUNTRY ON GRAPH PCHOLD FORMAT PNG ON GRAPH SET VZERO OFF ON GRAPH SET HTMLENCODE ON ON GRAPH SET GRAPHDEFAULT OFF ON GRAPH SET UNITS &WF_STYLE_UNITS ON GRAPH SET HAXIS &WF_STYLE_WIDTH ON GRAPH SET VAXIS &WF_STYLE_HEIGHT ON GRAPH SET GRMERGE ADVANCED ON GRAPH SET GRMULTIGRAPH 0 ON GRAPH SET GRLEGEND 0 ON GRAPH SET GRXAXIS 1 ON GRAPH SET LOOKGRAPH HBAR ON GRAPH SET STYLE * *GRAPH_SCRIPT setPieDepth(0); setPieTilt(0); setDepthRadius(0); setCurveFitEquationDisplay(false); setPlace(true); *END INCLUDE=endeflt.sty,$ TYPE=REPORT, TITLETEXT='WebFOCUS Report', $ *GRAPH_SCRIPT setReportParsingErrors(false); setSelectionEnableMove(false); setDisplay(getY1MajorGrid(),false); setTransparentBorderColor(getFrame(),true); setTransparentBorderColor(getFrameSide(), true); setFillColor(getFrame(),new Color(255,255,255)); setDisplay(getO1MajorGrid(),false); setTransparentFillColor(getFrame(),true); setDisplay(getDataText(0), true); setFontName(getDataText(),"ARIAL"); setFontSizeAbsolute(getDataText(),true); setAutofit(getDataText(),false); setPlaceResize(getDataText(),0); setFontStyle(getDataText(),0); setFrameAutoShade(true); setDisplay(getY1Label(),false); setPieTilt(0); setPieDepth(0); setDepthRadius(0); setDepthAngle(0); setDisplay(getLegendArea(),false); setFontSizeInPoints(getDataText(),10); setFillColor(getChartBackground(),new Color(255,255,255,0)); setTransparentBorderColor(getChartBackground(),true); setDisplay(getY1AxisLine(),false); *END ENDSTYLE END -*IA_GRAPH_FINISH WebFOCUS 8.004 Unix, PDF | |||
|
| Powered by Social Strata |
| Please Wait. Your request is being processed... |
Read-Only Topic| View $GS_USERNAME's Public Profile | |
| Add $GS_USERNAME to my Ignore List | |
| View Recent Posts by $GS_USERNAME | |
| Notify me of New Posts by $GS_USERNAME |