[SOLVED] Cloropleth map legend shows "B" for billions, numbers are really millions
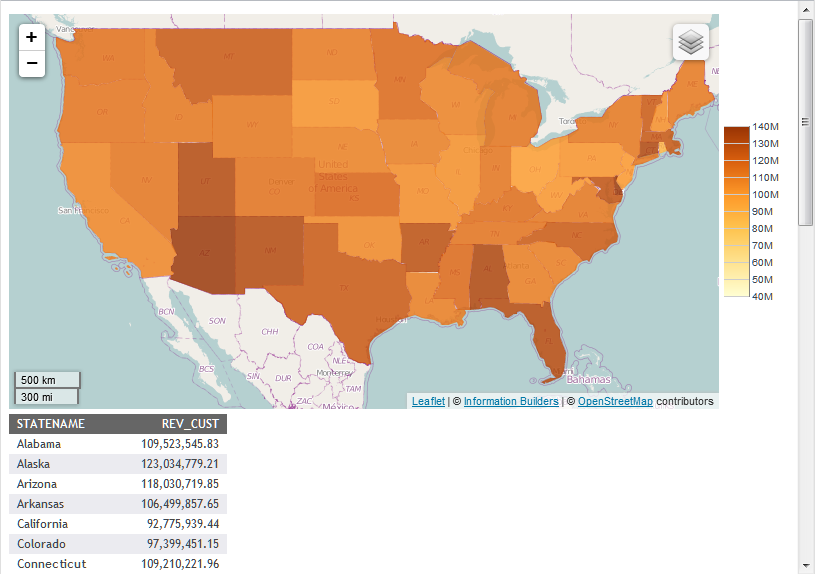
I have set up a heat map in WebFocus that graphs invoice $'s from an excel spreadsheet on a US map by state. When I put the cursor over each state, the correct $ amount is displayed, but the $ amount on the legend that is being displayed is incorrect. For example, when I place the cursor over Texas, it shows the invoice amount to be 517.1M (which is correct) and it is green in color, but the legend is showing the green to be 6B. Are we correct in thinking that 517.1M is 517,100,000 (or 517 million)? Shouldn't the legend be showing the green to be 600M? Has anyone ever run into this before? Is there something I am missing on this? We are using WebFocus 8.005. Thanks!This message has been edited. Last edited by: <Kathryn Henning>,
WebFOCUS 8.005 All Outputs
March 13, 2014, 08:20 PM
Francis Mariani
Lana, did you (or Advanced Graph Assistant) add this to the graph style: setY1LabelFormat(n) ? Depending on which n you choose, what you describe can occur. Read the "Graphics" manual for the different values you can use for setY1LabelFormat.
Francis
Give me code, or give me retirement. In FOCUS since 1991
Production: WF 7.7.05M, Dev Studio, BID, MRE, WebSphere, DB2 / Test: WF 8.1.05M, App Studio, BI Portal, Report Caster, jQuery, HighCharts, Apache Tomcat, MS SQL Server
March 13, 2014, 10:29 PM
susannah
and would you change your version in your signature, please? i was amazed that maps were in 7.6...
In Focus since 1979///7706m/5 ;wintel 2008/64;OAM security; Oracle db, ///MRE/BID
March 14, 2014, 11:51 AM
Lana Malone
Francis -
Thank you for your feedback on this issue. The setY1LabelFormat(n) was not set, so I tried setting it as you suggested. I tried different values for n - such as -3, -2... and nothing seemed to change. I'm not sure if I was doing something incorrect with this.
I ended up simply setting the setScaleMaxAuto(getY1Axis(),false) and giving it a max of 600M. That seems to give me what I was looking for. Thanks again for your help.
WebFOCUS 8.005 All Outputs
March 21, 2014, 05:04 AM
Tony A
Hi Lana,
I have just tried this in 8.0.0.6 and all looks OK. I have used both IE10 and Chrome21 to check the output (not that there should be any difference!
I also checked the code produced and there is nothing special there to control max or min axis values.
T
In FOCUS since 1986
WebFOCUS Server 8.2.01M, thru 8.2.07 on Windows Svr 2008 R2
WebFOCUS App Studio 8.2.06 standalone on Windows 10
March 27, 2014, 02:50 AM
MrM
Hi Tony
Looks great do you have some sample code?
Kind regards
Mark
March 31, 2014, 04:32 AM
Tony A
Hi Mark,
What release are you on? Your signature states 7.7.01 and if that is the case then I am not sure that you can get map charts in that release.
T
In FOCUS since 1986
WebFOCUS Server 8.2.01M, thru 8.2.07 on Windows Svr 2008 R2
WebFOCUS App Studio 8.2.06 standalone on Windows 10
April 01, 2014, 04:28 AM
MrM
Hi Tony
I have to change my states we are using WF 8.
Kind Regards
Mark
April 01, 2014, 06:11 AM
Tony A
Hi Mark,
Ok, I'll try and step you through making that chart. I will use the Retail sample database as it has a table with some geographic data of the type that the cloropleth chart requires. It is also an HTML5 type chart so you'll need to use a browser that supports HTML5.
For the Retail sample data, you will need to be able to create the database and tables for the Retail sample (MS SQL server or MS Access only I think).
Assuming all is OK, go to the RS console (server:8121) and click on an application directory - I created a new one and called it WF_RETAIL.
Right click on this folder and select new / samples. From the list click on WebFOCUS - Retail Demo and then check the other options as necessary.
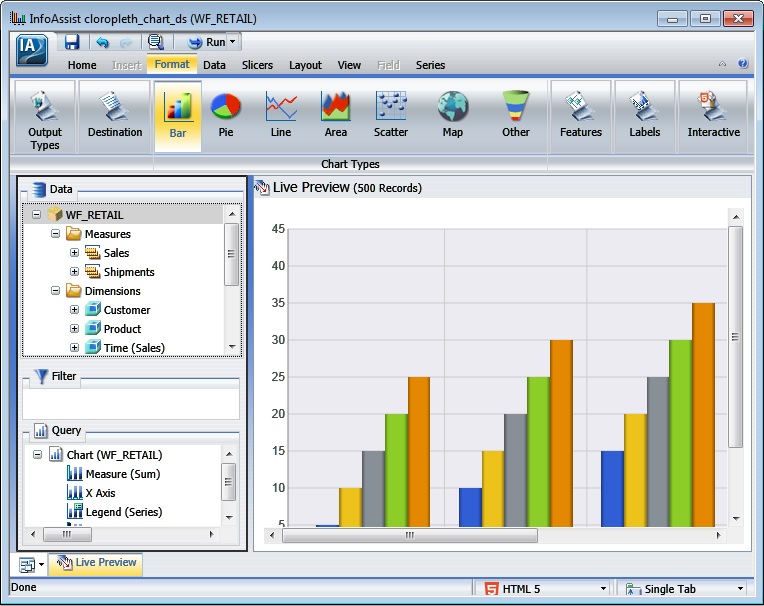
I'm assuming that you are using Dev Studio. Create a new procedure (using the GUI of course ) and then within that create a chart using the "Map" type with a source of WF_RETAIL (which is a cluster join). The left hand of the two maps is the one for cloropleth (hover over to see the tooltip), so select that one and a territory of US of A and the colour scale that you like (wear your sunglasses for the bottom one ).
Under Measures / Sales, double click Revenue, then under Dimensions / Customer / Customer / State / Attributes, double click "State,Code" to add it to the "Location axis". This will launch a dialog asking for the location type - in this case it is "State Abbreviation". Click OK and then run your procedure.
Now, how easy was that? I counted a total of 22 left mouse clicks in creating just the procedure (double click = 2 obviously )
Let me know how you get on.
T
In FOCUS since 1986
WebFOCUS Server 8.2.01M, thru 8.2.07 on Windows Svr 2008 R2
WebFOCUS App Studio 8.2.06 standalone on Windows 10
April 01, 2014, 06:15 AM
Tony A
BTW, you can use GGSALES but there are only about 12 states with data and it looks a little sparse!
T
In FOCUS since 1986
WebFOCUS Server 8.2.01M, thru 8.2.07 on Windows Svr 2008 R2
WebFOCUS App Studio 8.2.06 standalone on Windows 10
April 01, 2014, 07:04 AM
MrM
Tony,
Thanks I will try it later.
Regards
Mark
April 02, 2014, 01:31 AM
MrM
Tony
We don't have the Retail sample database so I tried it with data off our own. (the data includes the attributes Latitude and Longitude) But starting with the procedure, I can't find the chart type MAP. Do you know if this is a standard WF feature.
Mark
April 02, 2014, 08:25 AM
Tony A
Mark,
If you have WF8 DS then when you create a new chart you should get this dialog - T
In FOCUS since 1986
WebFOCUS Server 8.2.01M, thru 8.2.07 on Windows Svr 2008 R2
WebFOCUS App Studio 8.2.06 standalone on Windows 10
April 03, 2014, 01:51 AM
MrM
Tony,
I don't have the Map chart type see : (I hope the file is included) Do I have to make some changes in the settings?
Regards Mark
April 03, 2014, 03:50 AM
Tony A
Mark,
Your dropbox image isn't showing.
Also, what version of 8 are you on? For your server, run a fex with ? VERSION in it. For DS use help/about.
I'm not sure whether you need to be licensed - perhaps Kathryn might be able to advise?
T
In FOCUS since 1986
WebFOCUS Server 8.2.01M, thru 8.2.07 on Windows Svr 2008 R2
WebFOCUS App Studio 8.2.06 standalone on Windows 10
April 03, 2014, 04:34 AM
MrM
Tony,
The only differrence in the image I send is that I don't have the globe with MAP under it.
Versions : DS : EDA8004 Release * Current Software: Release GEN_NUM = 128 Server : EDA8001 Release * Current Software: Release GEN_NUM = 102
How can I get in touch with Kathryn.
April 03, 2014, 07:41 AM
Tony A
Hi Mark,
Kathryn monitors the forum and will, hopefully, pick this up and advise on licensing .
As regards mapping, if you're the Mark I think that you are, then you have my email address, please contact me directly.
If not then please send me a PM (click my name to the left and select "invite xxxx to a private topic".
T
In FOCUS since 1986
WebFOCUS Server 8.2.01M, thru 8.2.07 on Windows Svr 2008 R2
WebFOCUS App Studio 8.2.06 standalone on Windows 10
April 03, 2014, 07:43 PM
<Kathryn Henning>
Hi Mark and Tony,
I'll find out the status of maps in InfoAssist and licensing.
Mark, regarding your WebFOCUS versions, the WebFOCUS Client and Developer Studio should be at the same release and can be lower than the Reporting Server but not higher. It is recommended that they all be at the same release. Since your version of Developer Studio (and possibly WebFOCUS Client) is higher, this may account for why you're not seeing the map icon. Please see:
what is the best way to find the release of the WebFOCUS Client.
Kind regards
Mark
April 04, 2014, 08:47 AM
Tony A
Hi Mark,
From the Admin Console, click the link in the top right for "WebFOCUS Info"
T
In FOCUS since 1986
WebFOCUS Server 8.2.01M, thru 8.2.07 on Windows Svr 2008 R2
WebFOCUS App Studio 8.2.06 standalone on Windows 10
April 04, 2014, 08:58 AM
Tony A
Hi Mark,
I managed to see your image file and noticed that you have PNG format selected. Please go to the "Home" tab and select HTML5 to see if the Map icon is then shown.
T
In FOCUS since 1986
WebFOCUS Server 8.2.01M, thru 8.2.07 on Windows Svr 2008 R2
WebFOCUS App Studio 8.2.06 standalone on Windows 10
April 07, 2014, 12:45 AM
MrM
Hi Tony
These are the results of the "WebFOCUS info" :
WebFOCUS Business Intelligence
Edition: WebFOCUS Product Release: 8.0 Service Pack: 01 Build Version: branch8001_maint Build/GEN Number: 22 Build/GEN Date: Thu Oct 25 20:43:20 CEST 2012 Application Server: Apache Tomcat/7.0.29
I did not realize that I had placed the wrong image, but also the choice of HTML5, gives no MAP (globe) type.
Mark
April 07, 2014, 04:12 AM
Tony A
Hi Mark,
It might be best for you to raise this with Tech Support.
T
In FOCUS since 1986
WebFOCUS Server 8.2.01M, thru 8.2.07 on Windows Svr 2008 R2
WebFOCUS App Studio 8.2.06 standalone on Windows 10