*GRAPH_JS
legend: {visible:false},
series: [
{series: 0, color: 'blue',
tooltip: function(d, s, g) {
Corrections_Today = this.getGroupLabel(g).substr(21,9);
Corrections_Today = this.formatNumber(Corrections_Today, '###,###,###.');
Corrections_To_Date = this.getGroupLabel(g).substr(11,9);
Corrections_To_Date = this.formatNumber(Corrections_To_Date, '###,###,###.');
// setGroupLabel(0, "test");
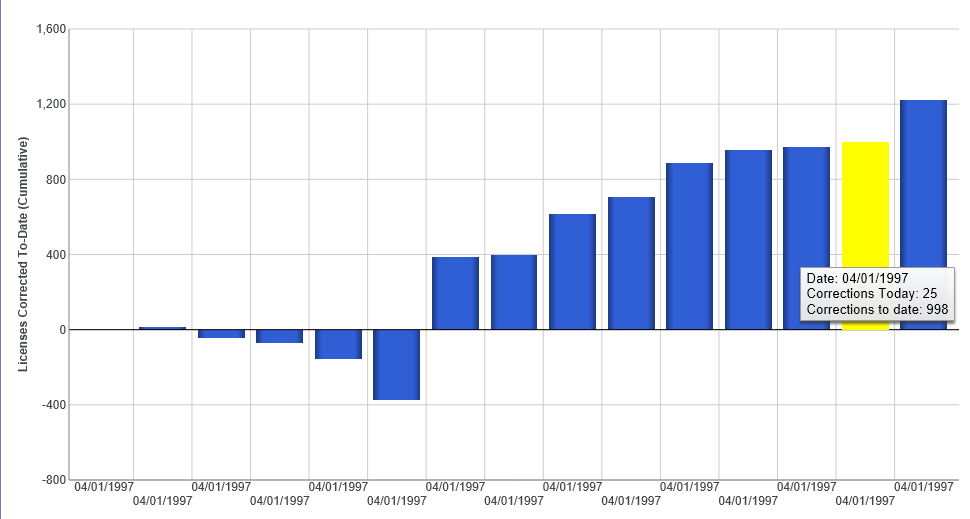
return ' Date: ' + this.getGroupLabel(g).substr(0,10) + '<br>'
+ ' Corrections Today: ' + Corrections_Today + '<br>'
+ ' Corrections To Date: ' + Corrections_To_Date}},
]
*END
| In FOCUS since 1986 | WebFOCUS Server 8.2.01M, thru 8.2.07 on Windows Svr 2008 R2 | ||
| WebFOCUS App Studio 8.2.06 standalone on Windows 10 |
| In FOCUS since 1986 | WebFOCUS Server 8.2.01M, thru 8.2.07 on Windows Svr 2008 R2 | ||
| WebFOCUS App Studio 8.2.06 standalone on Windows 10 |
-DEFAULTH &WF_STYLE_UNITS='PIXELS';
-DEFAULTH &WF_STYLE_HEIGHT='405.0';
-DEFAULTH &WF_STYLE_WIDTH='770.0';
-DEFAULTH &WF_TITLE='WebFOCUS Report';

DEFINE FILE GGSALES
  LICENSES_CORRECTED_THIS_DAY/I9CS = IF LAST UNITS EQ 0 THEN 0
                                   ELSE LAST UNITS - UNITS;
  CUMULATIVE_LICENSES_CORRECTED/I9CS = IF LAST CUMULATIVE_LICENSES_CORRECTED EQ 0 THEN LICENSES_CORRECTED_THIS_DAY
                                       ELSE LAST CUMULATIVE_LICENSES_CORRECTED + LICENSES_CORRECTED_THIS_DAY;
END

DEFINE FILE GGSALES ADD
  LEGEND/A100 = EDIT(EDIT(DATE), '$$$$99/99/') | EDIT(EDIT(DATE), '9999') | '@' | EDIT(CUMULATIVE_LICENSES_CORRECTED) | '@' | EDIT(LICENSES_CORRECTED_THIS_DAY);
END

GRAPH FILE GGSALES
SUM CUMULATIVE_LICENSES_CORRECTED AS 'Licenses Corrected To-Date (Cumulative)'
-*    COMPUTE TEXT_TO_GRAB/A100 = EDIT(DATECVT(DATE_RECORDED, 'MDYY', 'A8MDYY'), '99/99/9999') | '@' | EDIT(CUMULATIVE_LICENSES_CORRECTED) | '@' | EDIT(LICENSES_CORRECTED_THIS_DAY); NOPRINT
-*    LICENSES_CORRECTED_THIS_DAY
BY LEGEND AS ''
WHERE LEGEND CONTAINS '04/01/1997';
WHERE RECORDLIMIT EQ 15;
ON GRAPH PCHOLD FORMAT JSCHART
ON GRAPH SET VZERO OFF
ON GRAPH SET HTMLENCODE ON
ON GRAPH SET GRAPHDEFAULT OFF
ON GRAPH SET GRWIDTH 1
ON GRAPH SET UNITS &WF_STYLE_UNITS
ON GRAPH SET HAXIS &WF_STYLE_WIDTH
ON GRAPH SET VAXIS &WF_STYLE_HEIGHT
ON GRAPH SET GRMERGE ADVANCED
ON GRAPH SET GRMULTIGRAPH 0
ON GRAPH SET GRLEGEND 0
ON GRAPH SET GRXAXIS 1
ON GRAPH SET LOOKGRAPH VBAR
ON GRAPH SET AUTOFIT ON
ON GRAPH SET STYLE *
*GRAPH_JS
legend: {visible:false},
series: [
   {series: 0, color: 'blue',
            tooltip: function(d, s, g) {

                  Corrections_Today = this.getGroupLabel(g).substr(21,9);
                  Corrections_Today = this.formatNumber(Corrections_Today, '###,###,###.');

                  Corrections_To_Date = this.getGroupLabel(g).substr(11,9);
                  Corrections_To_Date = this.formatNumber(Corrections_To_Date, '###,###,###.');

//                  this.setGroupLabelArray("test");

  		       return ' Date: ' + this.getGroupLabel(g).substr(0,10) + '<br>'
			        + ' Corrections Today: ' + Corrections_Today + '<br>'
		            + ' Corrections To Date: ' + Corrections_To_Date},
    }
]

*END
*GRAPH_SCRIPT
groupLabels: 'Series One Three'
setPieDepth(0);
setPieTilt(0);
setDepthRadius(0);
setCurveFitEquationDisplay(false);
setPlace(true);
*END
INCLUDE=IBFS:/FILE/IBI_HTML_DIR/javaassist/intl/EN/ENIADefault_combine.sty,$
TYPE=REPORT, TITLETEXT=&WF_TITLE.QUOTEDSTRING, $
*GRAPH_SCRIPT
setReportParsingErrors(false);
setSelectionEnableMove(false);
setTextRotation(getO1Label(),3);
setColorMode(1);
setTextString(getO1Title(),"");
setLabelColor(get01Label(),new Color(255,255,255));
setFillColor(getFrame(),new Color(255,255,255));
setFillColor(getSeries(1),new Color(235,235,235));
*END
ENDSTYLE
END
-RUN
| In FOCUS since 1986 | WebFOCUS Server 8.2.01M, thru 8.2.07 on Windows Svr 2008 R2 | ||
| WebFOCUS App Studio 8.2.06 standalone on Windows 10 |
DEFINE FILE GGSALES
  LICENSES_CORRECTED_THIS_DAY/I9CS = IF LAST UNITS EQ 0 THEN 0
                                   ELSE LAST UNITS - UNITS;
  CUMULATIVE_LICENSES_CORRECTED/I9CS = IF LAST CUMULATIVE_LICENSES_CORRECTED EQ 0 THEN LICENSES_CORRECTED_THIS_DAY
                                       ELSE LAST CUMULATIVE_LICENSES_CORRECTED + LICENSES_CORRECTED_THIS_DAY;
  LEGEND/A100 = EDIT(EDIT(DATE), '$$$$99/99/') | EDIT(EDIT(DATE), '9999') | '@' | EDIT(CUMULATIVE_LICENSES_CORRECTED) | '@' | EDIT(LICENSES_CORRECTED_THIS_DAY);
  DISPDATE/MDYY = DATE;
END
ENGINE INT CACHE SET ON
SET PAGE-NUM=NOLEAD
-DEFAULTH &WF_HTMLENCODE=ON;
SET HTMLENCODE=&WF_HTMLENCODE
SET ARGRAPHENGINE=JSCHART
SET EMBEDHEADING=ON
SET GRAPHDEFAULT=OFF
-DEFAULTH &WF_STYLE_UNITS='PIXELS';
-DEFAULTH &WF_STYLE_HEIGHT='405.0';
-DEFAULTH &WF_STYLE_WIDTH='770.0';
-DEFAULTH &WF_TITLE='WebFOCUS Report';
GRAPH FILE GGSALES
-* Created by Info Assist for Graph
SUM GGSALES.SALES01.CUMULATIVE_LICENSES_CORRECTED AS 'Licenses Corrected To-Date (Cumulative)'
GGSALES.SALES01.DISPDATE AS 'Date'
GGSALES.SALES01.LICENSES_CORRECTED_THIS_DAY AS 'Corrections Today'
GGSALES.SALES01.CUMULATIVE_LICENSES_CORRECTED AS 'Corrections to date'
BY GGSALES.SALES01.LEGEND NOPRINT
BY GGSALES.SALES01.DISPDATE AS ''
WHERE GGSALES.SALES01.LEGEND CONTAINS '04/01/1997';
WHERE RECORDLIMIT EQ 15;
ON GRAPH PCHOLD FORMAT JSCHART
ON GRAPH SET VZERO OFF
ON GRAPH SET GRWIDTH 1
ON GRAPH SET AUTOFIT ON
ON GRAPH SET UNITS &WF_STYLE_UNITS
ON GRAPH SET HAXIS &WF_STYLE_WIDTH
ON GRAPH SET VAXIS &WF_STYLE_HEIGHT
ON GRAPH SET LOOKGRAPH BAR
ON GRAPH SET AUTOFIT ON
ON GRAPH SET STYLE *
*GRAPH_SCRIPT
setPieDepth(0);
setPieTilt(0);
setDepthRadius(0);
setPlace(true);
setCurveFitEquationDisplay(false);
*END
INCLUDE=endeflt.sty,$
TYPE=REPORT, TITLETEXT=&WF_TITLE.QUOTEDSTRING, $
TYPE=DATA, COLUMN=N1, BUCKET=x-axis, $
TYPE=DATA, COLUMN=N2, BUCKET=x-axis, $
TYPE=DATA, COLUMN=N3, BUCKET=y-axis, $
TYPE=DATA, COLUMN=N4, BUCKET=tooltip, $
TYPE=DATA, COLUMN=N5, BUCKET=tooltip, $
TYPE=DATA, COLUMN=N6, BUCKET=tooltip, $
*GRAPH_SCRIPT
setSelectionEnableMove(false);
setReportParsingErrors(false);
groupLabels: 'Series One Three'
setTextRotation(getO1Label(),3);
setColorMode(1);
setTextString(getO1Title(),"");
setLabelColor(get01Label(),new Color(255,255,255));
setFillColor(getFrame(),new Color(255,255,255));
setFillColor(getSeries(1),new Color(235,235,235));
*END
*GRAPH_JS_FINAL
"series": [
	{"series": 0,
		"tooltip": 'Date: {{tooltip1}}<br>Corrections Today: {{tooltip2}}<br>Corrections to date: {{tooltip3}}'
	}
]
*END
ENDSTYLE
END
-RUN| In FOCUS since 1986 | WebFOCUS Server 8.2.01M, thru 8.2.07 on Windows Svr 2008 R2 | ||
| WebFOCUS App Studio 8.2.06 standalone on Windows 10 |
| In FOCUS since 1986 | WebFOCUS Server 8.2.01M, thru 8.2.07 on Windows Svr 2008 R2 | ||
| WebFOCUS App Studio 8.2.06 standalone on Windows 10 |