 |
|||||
|
As of December 1, 2020, Focal Point is retired and repurposed as a reference repository. We value the wealth of knowledge that's been shared here over the years. You'll continue to have access to this treasure trove of knowledge, for search purposes only. Join the TIBCO Community
Former myibi community members should have received an email on 8/3/22 to activate their user accounts to join the community. Check your Spam folder for the email. Please get in touch with us at community@tibco.com for further assistance. Reference the community FAQ to learn more about the community. | |||||
 WebFOCUS/FOCUS Forum on Focal Point Read-Only Topic
Go | Search | Notify | Tools |
| [CLOSED] Display two HTML5 graphs in one report | Login/Join |
| Gold member |
Hi again, I'm working on getting multiple HTML5 graphs to display from one fex file but I'm having issues doing it. When I incorporate two graphs into the procedure it will not display both graphs. After some google work I found a solution where someone put the two graphs into a hold and used an HTML page to display the two graphs. When I do that however the styling of the first graphs goes away. I've included the code below of the two hold graphs, the HTML page, and what the end results currently is. -*IA_GRAPH_BEGIN -*Do not delete or modify the comments below *-INTERNAL_COMMENT LINE#0$PD94bWwgdmVyc2lvbj0iMS4wIiBlbmNvZGluZz0iVVRGLTgiIHN0YW5kYWxvbmU9Im5vIj8+DQo8IS0tMS4wLS0+DQo8Um9vdCB2ZXJzaW9uPSIxLjAiPg0KICAgIDxPYmplY3Qgb2JqZWN0SWQ9IkNoYXJ0XzEiPg0KICAgICAgICA8UHJvcGVydHkgbmFtZT0iTGlua2VkU29ydHMiIHR5cGU9ImphdmEubGFuZy5TdHJpbmciLz4NCiAgICAgICAgPFByb3BlcnR5IG5hbWU9IkNyb3NzVGFiTW9kZSIgdHlwZT0iamF2YS5sYW5nLkJvb2xlYW4iPnRydWU8L1Byb3BlcnR5Pg0KICAgICAgICA8UHJvcGVydHkgbmFtZT0iY3VzdG9tV2hlcmVzIiB0eXBlPSJNYXAiLz4NCiAgICA8L09iamVjdD4NCiAgICA8T2JqZWN0IG9iamVjdElkPSJHTE9CQUwiPg0KICAgICAgICA8UHJvcGVydHkgbmFtZT0iU2FtcGxlRGF0YSIgdHlwZT0iamF2YS5sYW5nLkJvb2xlYW4iPmZhbHNlPC9Qcm9wZXJ0eT4NCiAgICAgICAgPFByb3BlcnR5IG5hbWU9Ikdsb2JhbFJlY29yZExpbWl0IiB0eXBlPSJqYXZhLmxhbmcuU3RyaW5nIj41MDA8L1Byb3BlcnR5Pg0KICAgICAgICA8UHJvcGVydHkgbmFtZT0iR2xvYmFsUnVuUmVjb3JkTGltaXQiIHR5cGU9ImphdmEubGFuZy5TdHJpbmciPjA8L1Byb3BlcnR5Pg0KICAgICAgICA8UHJvcGVydHkgbmFtZT0iZmllbGREaXNwbGF5TW9kZSIgdHlwZT0iamF2YS5sYW5nLlN0cmluZyI+bGFiZWw8L1Byb3BlcnR5Pg0KICAgICAgICA8UHJvcGVydHkgbmFtZT0icHJlZml4RGlzcGxheU1vZGUiIHR5cGU9ImphdmEubGFuZy5TdHJpbmciLz4NCiAgICAgICAgPFByb3BlcnR5IG5hbWU9IkFjdGl2ZV9TdHlsZV9Vc2VyX3R5cGUiIHR5cGU9ImphdmEubGFuZy5TdHJpbmciPnBvd2VyPC9Qcm9wZXJ0eT4NCiAgICAgICAgPFByb3BlcnR5IG5hbWU9Ikdsb2JhbFZhbHVlc1BhZ2luZyIgdHlwZT0iamF2YS5sYW5nLlN0cmluZyI+NDwvUHJvcGVydHk+DQogICAgICAgIDxQcm9wZXJ0eSBuYW1lPSJtZXRhZGF0YVZpZXdBcyIgdHlwZT0iTWFwIj4NCiAgICAgICAgICAgIDxFbnRyeSBrZXk9IkZSRVNITUFOU1VDQ0VTU1JBVEUiIHR5cGU9ImphdmEubGFuZy5TdHJpbmciPk1ldGFEYXRhVHJlZS5WSUVXX0RJTVM8L0VudHJ5Pg0KICAgICAgICAgICAgPEVudHJ5IGtleT0iSE9MRCIgdHlwZT0iamF2YS5sYW5nLlN0cmluZyI+TWV0YURhdGFUcmVlLlZJRVdfRElNUzwvRW50cnk+DQogICAgICAgIDwvUHJvcGVydHk+DQogICAgICAgIDxQcm9wZXJ0eSBuYW1lPSJGb2NleGVjUHJlZmVyZW5jZXMiIHR5cGU9Ik1hcCI+DQogICAgICAgICAgICA8RW50cnkga2V5PSJkaXNwbGF5RWRpdE1vZGVJbmZvTWluaVByZWZlcmVuY2UiIHR5cGU9ImphdmEubGFuZy5TdHJpbmciPmZhbHNlPC9FbnRyeT4NCiAgICAgICAgICAgIDxFbnRyeSBrZXk9ImRpc3BsYXlGb3JtYXRUYWJJbmZvTWluaVByZWZlcmVuY2UiIHR5cGU9ImphdmEubGFuZy5TdHJpbmciPnRydWU8L0VudHJ5Pg0KICAgICAgICAgICAgPEVudHJ5IGtleT0iZGlzcGxheUhvbWVUYWJJbmZvTWluaVByZWZlcmVuY2UiIHR5cGU9ImphdmEubGFuZy5TdHJpbmciPmZhbHNlPC9FbnRyeT4NCiAgICAgICAgICAgIDxFbnRyeSBrZXk9ImRpc3BsYXlRdWlja0FjY2Vzc1Rvb2xiYXJTYXZlSW5mb01pbmlQcmVmZXJlbmNlIiB0eXBlPSJqYXZhLmxhbmcuU3RyaW5nIj50cnVlPC9FbnRyeT4NCiAgICAgICAgICAgIDxFbnRyeSBrZXk9ImRpc3BsYXlSZXNvdXJjZXNGaWVsZFRhYkluZm9NaW5pUHJlZmVyZW5jZSIgdHlwZT0iamF2YS5sYW5nLlN0cmluZyI+ZmFsc2U8L0VudHJ5Pg0KICAgICAgICAgICAgPEVudHJ5IGtleT0iZGlzcGxheUluc2VydFRhYkluZm9NaW5pUHJlZmVyZW5jZSIgdHlwZT0iamF2YS5sYW5nLlN0cmluZyI+ZmFsc2U8L0VudHJ5Pg0KICAgICAgICAgICAgPEVudHJ5IGtleT0iZGlzcGxheVNsaWNlcnNUYWJFZGl0SW5mb01pbmlQcmVmZXJlbmNlIiB0eXBlPSJqYXZhLmxhbmcuU3RyaW5nIj5mYWxzZTwvRW50cnk+DQogICAgICAgICAgICA8RW50cnkga2V5PSJkaXNwbGF5U2VyaWVzVGFiSW5mb01pbmlQcmVmZXJlbmNlIiB0eXBlPSJqYXZhLmxhbmcuU3RyaW5nIj5mYWxzZTwvRW50cnk+DQogICAgICAgICAgICA8RW50cnkga2V5PSJpbmZvQXNzaXN0TW9kZUFsbG93ZWRJbmZvTWluaVByZWZlcmVuY2UiIHR5cGU9ImphdmEubGFuZy5TdHJpbmciPmZhbHNlPC9FbnRyeT4NCiAgICAgICAgICAgIDxFbnRyeSBrZXk9ImRlZmF1bHRfcHJldmlld19wYWdlbGltaXRfbGF5b3V0IiB0eXBlPSJqYXZhLmxhbmcuU3RyaW5nIj4xPC9FbnRyeT4NCiAgICAgICAgICAgIDxFbnRyeSBrZXk9ImV4Y2VsX2Zvcm1hdF92aXNpYmxlIiB0eXBlPSJqYXZhLmxhbmcuU3RyaW5nIj50cnVlPC9FbnRyeT4NCiAgICAgICAgICAgIDxFbnRyeSBrZXk9ImRlZmF1bHRfcHJldmlld19wYWdlbGltaXQiIHR5cGU9ImphdmEubGFuZy5TdHJpbmciPjU8L0VudHJ5Pg0KICAgICAgICAgICAgPEVudHJ5IGtleT0iZGVmYXVsdF9jb21wb3NlX2Zvcm1hdCIgdHlwZT0iamF2YS5sYW5nLlN0cmluZyI+UERGPC9FbnRyeT4NCiAgICAgICAgICAgIDxFbnRyeSBrZXk9ImRpc3BsYXlJbnRlcmFjdGl2ZU1vZGVJbmZvTWluaVByZWZlcmVuY2UiIHR5cGU9ImphdmEubGFuZy5TdHJpbmciPnRydWU8L0VudHJ5Pg0KICAgICAgICAgICAgPEVudHJ5IGtleT0icnVuT25TdGFydHVwSW5mb01pbmlQcmVmZXJlbmNlIiB0eXBlPSJqYXZhLmxhbmcuU3RyaW5nIj50cnVlPC9FbnRyeT4NCiAgICAgICAgICAgIDxFbnRyeSBrZXk9ImRpc3BsYXlEYXRhVGFiSW5mb01pbmlQcmVmZXJlbmNlIiB0eXBlPSJqYXZhLmxhbmcuU3RyaW5nIj5mYWxzZTwvRW50cnk+DQogICAgICAgICAgICA8RW50cnkga2V5PSJlZGl0b3JUeXBlX3Zpc2libGUiIHR5cGU9ImphdmEubGFuZy5TdHJpbmciPnRydWU8L0VudHJ5Pg0KICAgICAgICAgICAgPEVudHJ5IGtleT0idGhl *-INTERNAL_COMMENT LINE#1$bWVzX2NvbnRyb2xfdmlzaWJsZSIgdHlwZT0iamF2YS5sYW5nLlN0cmluZyI+dHJ1ZTwvRW50cnk+DQogICAgICAgICAgICA8RW50cnkga2V5PSJkaXNwbGF5U2xpY2Vyc1RhYkludGVyYWN0aXZlSW5mb01pbmlQcmVmZXJlbmNlIiB0eXBlPSJqYXZhLmxhbmcuU3RyaW5nIj50cnVlPC9FbnRyeT4NCiAgICAgICAgICAgIDxFbnRyeSBrZXk9ImRpc3BsYXlMYXlvdXRUYWJJbmZvTWluaVByZWZlcmVuY2UiIHR5cGU9ImphdmEubGFuZy5TdHJpbmciPmZhbHNlPC9FbnRyeT4NCiAgICAgICAgPC9Qcm9wZXJ0eT4NCiAgICAgICAgPFByb3BlcnR5IG5hbWU9ImNhc2NhZGVOYW1lcyIgdHlwZT0iTWFwIi8+DQogICAgICAgIDxQcm9wZXJ0eSBuYW1lPSJNYXN0ZXJfRmlsZXMiIHR5cGU9IlNldCI+DQogICAgICAgICAgICA8RW50cnkgdHlwZT0iamF2YS5sYW5nLlN0cmluZyI+SE9MRDwvRW50cnk+DQogICAgICAgIDwvUHJvcGVydHk+DQogICAgICAgIDxQcm9wZXJ0eSBuYW1lPSJDaGFydEF1dG9maXRTaXplIiB0eXBlPSJqYXZhLmxhbmcuQm9vbGVhbiI+ZmFsc2U8L1Byb3BlcnR5Pg0KICAgICAgICA8UHJvcGVydHkgbmFtZT0iU2xpY2VyR3VpSXNsYW5kIiB0eXBlPSJqYXZhLmxhbmcuU3RyaW5nIj5leUppUVhWMGIxQnlaWFpwWlhjaU9tWmhiSE5sTENKaVQzQjBhVzl1YzBkeWIzVndWbWx6YVdKc1pTSTZkSEoxWlN3aVlsSmxZMHhwYldsMFIzSnZkWEJXYVhOcFlteGxJanAwY25WbExDSmlVSEpsZG1sbGQwTnZiblJ5YjJ4V2FYTnBZbXhsSWpwMGNuVmxMQ0ppVW5WdWRHbHRaVU52Ym5SeWIyeFdhWE5wWW14bElqcDBjblZsZlE9PTwvUHJvcGVydHk+DQogICAgICAgIDxQcm9wZXJ0eSBuYW1lPSJTTElDRVJfSU5GT1JNQVRJT04iIHR5cGU9ImphdmEubGFuZy5TdHJpbmciPlBEOTRiV3dnZG1WeWMybHZiajBpTVM0d0lpQmxibU52WkdsdVp6MGlWVlJHTFRnaUlITjBZVzVrWVd4dmJtVTlJbTV2SWo4K1BDRXRMVU5QVFZCTVJWUkZYMU5NU1VORlVsOUhVazlWVUMwdFBqeFRURWxEUlZKZlIxSlBWVkErUEVkU1QxVlFJR2R5YjNWd1RuVnRZbVZ5UFNJd0lpQnpiR2xqWlhKSGNtOTFjRXhoWW1Wc1BTSkhjbTkxY0NBeElpQnpiR2xqWlhKSGNtOTFjRTl5WkdWeVBTSXdJaUJ6YkdsalpYSkhjbTkxY0ZOcGVtVTlJakFpSUhOc2FXTmxja2R5YjNWd2FHbGtaVDBpWm1Gc2MyVWlMejQ4TDFOTVNVTkZVbDlIVWs5VlVEND08L1Byb3BlcnR5Pg0KICAgICAgICA8UHJvcGVydHkgbmFtZT0iZW5hYmxlUHJldmlldyIgdHlwZT0iamF2YS5sYW5nLkJvb2xlYW4iPnRydWU8L1Byb3BlcnR5Pg0KICAgIDwvT2JqZWN0Pg0KPC9Sb290Pg0K -*Do not delete or modify the comments above ENGINE INT CACHE SET ON GRAPH FILE HOLD -* Created by Info Assist for Graph SUM HOLD.HOLD.METRICDATA BY J7.UNIT.UNITDESC ACROSS HOLD.HOLD.METRICTIMEFRAMEDESCLONG WHERE HOLD.HOLD.METRICID EQ 113; WHERE HOLD.HOLD.METRICSERIESID EQ 418; ON GRAPH HOLD AS GRAPH1 FORMAT JSCHART ON GRAPH SET VZERO OFF ON GRAPH SET HTMLENCODE ON ON GRAPH SET GRAPHDEFAULT OFF ON GRAPH SET HAXIS 700.0 ON GRAPH SET VAXIS 150.0 ON GRAPH SET GRMERGE ADVANCED ON GRAPH SET GRMULTIGRAPH 0 ON GRAPH SET GRLEGEND 1 ON GRAPH SET GRXAXIS 1 ON GRAPH SET LOOKGRAPH VLINE ON GRAPH SET STYLE * *GRAPH_SCRIPT setPieDepth(0); setPieTilt(0); setDepthRadius(0); setCurveFitEquationDisplay(false); setPlace(true); setUseSeriesShapes(true); setMarkerSizeDefault(50); *END INCLUDE=IBFS:/FILE/IBI_HTML_DIR/javaassist/intl/EN/ENIADefault_combine.sty,$ TYPE=REPORT, TITLETEXT='WebFOCUS Report', $ *GRAPH_SCRIPT setReportParsingErrors(false); setSelectionEnableMove(false); setFillColor(getSeries(2),new Color(237,186,4)); setTransparentBorderColor(getSeries(2), false); setTransparentBorderColor(getSeries(1), false); setBorderColor(getSeries(1),new Color(213,213,0)); setBorderColor(getSeries(0),new Color(191,0,0)); setFillColor(getSeries(4),new Color(217,0,0)); setBorderColor(getSeries(4),new Color(255,255,255)); setDisplay(getO1Title(),false); setDisplay(getY1Title(),false); setFillColor(getSeries(0),new Color(0,128,0)); setFillColor(getSeries(1),new Color(255,128,0)); *END ENDSTYLE END -*IA_GRAPH_FINISH -*IA_GRAPH_BEGIN -*Do not delete or modify the comments below *-INTERNAL_COMMENT LINE#0$PD94bWwgdmVyc2lvbj0iMS4wIiBlbmNvZGluZz0iVVRGLTgiIHN0YW5kYWxvbmU9Im5vIj8+DQo8IS0tMS4wLS0+DQo8Um9vdCB2ZXJzaW9uPSIxLjAiPg0KICAgIDxPYmplY3Qgb2JqZWN0SWQ9IkNoYXJ0XzEiPg0KICAgICAgICA8UHJvcGVydHkgbmFtZT0iTGlua2VkU29ydHMiIHR5cGU9ImphdmEubGFuZy5TdHJpbmciLz4NCiAgICAgICAgPFByb3BlcnR5IG5hbWU9IkNyb3NzVGFiTW9kZSIgdHlwZT0iamF2YS5sYW5nLkJvb2xlYW4iPnRydWU8L1Byb3BlcnR5Pg0KICAgICAgICA8UHJvcGVydHkgbmFtZT0iY3VzdG9tV2hlcmVzIiB0eXBlPSJNYXAiLz4NCiAgICA8L09iamVjdD4NCiAgICA8T2JqZWN0IG9iamVjdElkPSJHTE9CQUwiPg0KICAgICAgICA8UHJvcGVydHkgbmFtZT0iU2FtcGxlRGF0YSIgdHlwZT0iamF2YS5sYW5nLkJvb2xlYW4iPmZhbHNlPC9Qcm9wZXJ0eT4NCiAgICAgICAgPFByb3BlcnR5IG5hbWU9Ikdsb2JhbFJlY29yZExpbWl0IiB0eXBlPSJqYXZhLmxhbmcuU3RyaW5nIj41MDA8L1Byb3BlcnR5Pg0KICAgICAgICA8UHJvcGVydHkgbmFtZT0iR2xvYmFsUnVuUmVjb3JkTGltaXQiIHR5cGU9ImphdmEubGFuZy5TdHJpbmciPjA8L1Byb3BlcnR5Pg0KICAgICAgICA8UHJvcGVydHkgbmFtZT0iZmllbGREaXNwbGF5TW9kZSIgdHlwZT0iamF2YS5sYW5nLlN0cmluZyI+bGFiZWw8L1Byb3BlcnR5Pg0KICAgICAgICA8UHJvcGVydHkgbmFtZT0icHJlZml4RGlzcGxheU1vZGUiIHR5cGU9ImphdmEubGFuZy5TdHJpbmciLz4NCiAgICAgICAgPFByb3BlcnR5IG5hbWU9IkFjdGl2ZV9TdHlsZV9Vc2VyX3R5cGUiIHR5cGU9ImphdmEubGFuZy5TdHJpbmciPnBvd2VyPC9Qcm9wZXJ0eT4NCiAgICAgICAgPFByb3BlcnR5IG5hbWU9Ikdsb2JhbFZhbHVlc1BhZ2luZyIgdHlwZT0iamF2YS5sYW5nLlN0cmluZyI+NDwvUHJvcGVydHk+DQogICAgICAgIDxQcm9wZXJ0eSBuYW1lPSJtZXRhZGF0YVZpZXdBcyIgdHlwZT0iTWFwIj4NCiAgICAgICAgICAgIDxFbnRyeSBrZXk9IkZSRVNITUFOU1VDQ0VTU1JBVEUiIHR5cGU9ImphdmEubGFuZy5TdHJpbmciPk1ldGFEYXRhVHJlZS5WSUVXX0RJTVM8L0VudHJ5Pg0KICAgICAgICAgICAgPEVudHJ5IGtleT0iSE9MRCIgdHlwZT0iamF2YS5sYW5nLlN0cmluZyI+TWV0YURhdGFUcmVlLlZJRVdfRElNUzwvRW50cnk+DQogICAgICAgIDwvUHJvcGVydHk+DQogICAgICAgIDxQcm9wZXJ0eSBuYW1lPSJGb2NleGVjUHJlZmVyZW5jZXMiIHR5cGU9Ik1hcCI+DQogICAgICAgICAgICA8RW50cnkga2V5PSJkaXNwbGF5RWRpdE1vZGVJbmZvTWluaVByZWZlcmVuY2UiIHR5cGU9ImphdmEubGFuZy5TdHJpbmciPmZhbHNlPC9FbnRyeT4NCiAgICAgICAgICAgIDxFbnRyeSBrZXk9ImRpc3BsYXlGb3JtYXRUYWJJbmZvTWluaVByZWZlcmVuY2UiIHR5cGU9ImphdmEubGFuZy5TdHJpbmciPnRydWU8L0VudHJ5Pg0KICAgICAgICAgICAgPEVudHJ5IGtleT0iZGlzcGxheUhvbWVUYWJJbmZvTWluaVByZWZlcmVuY2UiIHR5cGU9ImphdmEubGFuZy5TdHJpbmciPmZhbHNlPC9FbnRyeT4NCiAgICAgICAgICAgIDxFbnRyeSBrZXk9ImRpc3BsYXlRdWlja0FjY2Vzc1Rvb2xiYXJTYXZlSW5mb01pbmlQcmVmZXJlbmNlIiB0eXBlPSJqYXZhLmxhbmcuU3RyaW5nIj50cnVlPC9FbnRyeT4NCiAgICAgICAgICAgIDxFbnRyeSBrZXk9ImRpc3BsYXlSZXNvdXJjZXNGaWVsZFRhYkluZm9NaW5pUHJlZmVyZW5jZSIgdHlwZT0iamF2YS5sYW5nLlN0cmluZyI+ZmFsc2U8L0VudHJ5Pg0KICAgICAgICAgICAgPEVudHJ5IGtleT0iZGlzcGxheUluc2VydFRhYkluZm9NaW5pUHJlZmVyZW5jZSIgdHlwZT0iamF2YS5sYW5nLlN0cmluZyI+ZmFsc2U8L0VudHJ5Pg0KICAgICAgICAgICAgPEVudHJ5IGtleT0iZGlzcGxheVNsaWNlcnNUYWJFZGl0SW5mb01pbmlQcmVmZXJlbmNlIiB0eXBlPSJqYXZhLmxhbmcuU3RyaW5nIj5mYWxzZTwvRW50cnk+DQogICAgICAgICAgICA8RW50cnkga2V5PSJkaXNwbGF5U2VyaWVzVGFiSW5mb01pbmlQcmVmZXJlbmNlIiB0eXBlPSJqYXZhLmxhbmcuU3RyaW5nIj5mYWxzZTwvRW50cnk+DQogICAgICAgICAgICA8RW50cnkga2V5PSJpbmZvQXNzaXN0TW9kZUFsbG93ZWRJbmZvTWluaVByZWZlcmVuY2UiIHR5cGU9ImphdmEubGFuZy5TdHJpbmciPmZhbHNlPC9FbnRyeT4NCiAgICAgICAgICAgIDxFbnRyeSBrZXk9ImRlZmF1bHRfcHJldmlld19wYWdlbGltaXRfbGF5b3V0IiB0eXBlPSJqYXZhLmxhbmcuU3RyaW5nIj4xPC9FbnRyeT4NCiAgICAgICAgICAgIDxFbnRyeSBrZXk9ImV4Y2VsX2Zvcm1hdF92aXNpYmxlIiB0eXBlPSJqYXZhLmxhbmcuU3RyaW5nIj50cnVlPC9FbnRyeT4NCiAgICAgICAgICAgIDxFbnRyeSBrZXk9ImRlZmF1bHRfcHJldmlld19wYWdlbGltaXQiIHR5cGU9ImphdmEubGFuZy5TdHJpbmciPjU8L0VudHJ5Pg0KICAgICAgICAgICAgPEVudHJ5IGtleT0iZGVmYXVsdF9jb21wb3NlX2Zvcm1hdCIgdHlwZT0iamF2YS5sYW5nLlN0cmluZyI+UERGPC9FbnRyeT4NCiAgICAgICAgICAgIDxFbnRyeSBrZXk9ImRpc3BsYXlJbnRlcmFjdGl2ZU1vZGVJbmZvTWluaVByZWZlcmVuY2UiIHR5cGU9ImphdmEubGFuZy5TdHJpbmciPnRydWU8L0VudHJ5Pg0KICAgICAgICAgICAgPEVudHJ5IGtleT0icnVuT25TdGFydHVwSW5mb01pbmlQcmVmZXJlbmNlIiB0eXBlPSJqYXZhLmxhbmcuU3RyaW5nIj50cnVlPC9FbnRyeT4NCiAgICAgICAgICAgIDxFbnRyeSBrZXk9ImRpc3BsYXlEYXRhVGFiSW5mb01pbmlQcmVmZXJlbmNlIiB0eXBlPSJqYXZhLmxhbmcuU3RyaW5nIj5mYWxzZTwvRW50cnk+DQogICAgICAgICAgICA8RW50cnkga2V5PSJlZGl0b3JUeXBlX3Zpc2libGUiIHR5cGU9ImphdmEubGFuZy5TdHJpbmciPnRydWU8L0VudHJ5Pg0KICAgICAgICAgICAgPEVudHJ5IGtleT0idGhl *-INTERNAL_COMMENT LINE#1$bWVzX2NvbnRyb2xfdmlzaWJsZSIgdHlwZT0iamF2YS5sYW5nLlN0cmluZyI+dHJ1ZTwvRW50cnk+DQogICAgICAgICAgICA8RW50cnkga2V5PSJkaXNwbGF5U2xpY2Vyc1RhYkludGVyYWN0aXZlSW5mb01pbmlQcmVmZXJlbmNlIiB0eXBlPSJqYXZhLmxhbmcuU3RyaW5nIj50cnVlPC9FbnRyeT4NCiAgICAgICAgICAgIDxFbnRyeSBrZXk9ImRpc3BsYXlMYXlvdXRUYWJJbmZvTWluaVByZWZlcmVuY2UiIHR5cGU9ImphdmEubGFuZy5TdHJpbmciPmZhbHNlPC9FbnRyeT4NCiAgICAgICAgPC9Qcm9wZXJ0eT4NCiAgICAgICAgPFByb3BlcnR5IG5hbWU9ImNhc2NhZGVOYW1lcyIgdHlwZT0iTWFwIi8+DQogICAgICAgIDxQcm9wZXJ0eSBuYW1lPSJNYXN0ZXJfRmlsZXMiIHR5cGU9IlNldCI+DQogICAgICAgICAgICA8RW50cnkgdHlwZT0iamF2YS5sYW5nLlN0cmluZyI+SE9MRDwvRW50cnk+DQogICAgICAgIDwvUHJvcGVydHk+DQogICAgICAgIDxQcm9wZXJ0eSBuYW1lPSJDaGFydEF1dG9maXRTaXplIiB0eXBlPSJqYXZhLmxhbmcuQm9vbGVhbiI+ZmFsc2U8L1Byb3BlcnR5Pg0KICAgICAgICA8UHJvcGVydHkgbmFtZT0iU2xpY2VyR3VpSXNsYW5kIiB0eXBlPSJqYXZhLmxhbmcuU3RyaW5nIj5leUppUVhWMGIxQnlaWFpwWlhjaU9tWmhiSE5sTENKaVQzQjBhVzl1YzBkeWIzVndWbWx6YVdKc1pTSTZkSEoxWlN3aVlsSmxZMHhwYldsMFIzSnZkWEJXYVhOcFlteGxJanAwY25WbExDSmlVSEpsZG1sbGQwTnZiblJ5YjJ4V2FYTnBZbXhsSWpwMGNuVmxMQ0ppVW5WdWRHbHRaVU52Ym5SeWIyeFdhWE5wWW14bElqcDBjblZsZlE9PTwvUHJvcGVydHk+DQogICAgICAgIDxQcm9wZXJ0eSBuYW1lPSJTTElDRVJfSU5GT1JNQVRJT04iIHR5cGU9ImphdmEubGFuZy5TdHJpbmciPlBEOTRiV3dnZG1WeWMybHZiajBpTVM0d0lpQmxibU52WkdsdVp6MGlWVlJHTFRnaUlITjBZVzVrWVd4dmJtVTlJbTV2SWo4K1BDRXRMVU5QVFZCTVJWUkZYMU5NU1VORlVsOUhVazlWVUMwdFBqeFRURWxEUlZKZlIxSlBWVkErUEVkU1QxVlFJR2R5YjNWd1RuVnRZbVZ5UFNJd0lpQnpiR2xqWlhKSGNtOTFjRXhoWW1Wc1BTSkhjbTkxY0NBeElpQnpiR2xqWlhKSGNtOTFjRTl5WkdWeVBTSXdJaUJ6YkdsalpYSkhjbTkxY0ZOcGVtVTlJakFpSUhOc2FXTmxja2R5YjNWd2FHbGtaVDBpWm1Gc2MyVWlMejQ4TDFOTVNVTkZVbDlIVWs5VlVEND08L1Byb3BlcnR5Pg0KICAgICAgICA8UHJvcGVydHkgbmFtZT0iZW5hYmxlUHJldmlldyIgdHlwZT0iamF2YS5sYW5nLkJvb2xlYW4iPnRydWU8L1Byb3BlcnR5Pg0KICAgIDwvT2JqZWN0Pg0KPC9Sb290Pg0K -*Do not delete or modify the comments above ENGINE INT CACHE SET ON GRAPH FILE HOLD -* Created by Info Assist for Graph SUM HOLD.HOLD.METRICDATA BY J7.UNIT.UNITDESC ACROSS HOLD.HOLD.METRICTIMEFRAMEDESCLONG WHERE HOLD.HOLD.METRICID EQ 113; WHERE HOLD.HOLD.METRICSERIESID EQ 434; ON GRAPH HOLD AS GRAPH2 FORMAT JSCHART ON GRAPH SET VZERO OFF ON GRAPH SET HTMLENCODE ON ON GRAPH SET GRAPHDEFAULT OFF ON GRAPH SET HAXIS 700.0 ON GRAPH SET VAXIS 150.0 ON GRAPH SET GRMERGE ADVANCED ON GRAPH SET GRMULTIGRAPH 0 ON GRAPH SET GRLEGEND 1 ON GRAPH SET GRXAXIS 1 ON GRAPH SET LOOKGRAPH VLINE ON GRAPH SET STYLE * *GRAPH_SCRIPT setPieDepth(0); setPieTilt(0); setDepthRadius(0); setCurveFitEquationDisplay(false); setPlace(true); setUseSeriesShapes(true); setMarkerSizeDefault(50); *END INCLUDE=IBFS:/FILE/IBI_HTML_DIR/javaassist/intl/EN/ENIADefault_combine.sty,$ TYPE=REPORT, TITLETEXT='WebFOCUS Report', $ *GRAPH_SCRIPT setReportParsingErrors(false); setSelectionEnableMove(false); setFillColor(getSeries(2),new Color(237,186,4)); setTransparentBorderColor(getSeries(2), false); setTransparentBorderColor(getSeries(1), false); setBorderColor(getSeries(1),new Color(213,213,0)); setBorderColor(getSeries(0),new Color(191,0,0)); setFillColor(getSeries(4),new Color(217,0,0)); setBorderColor(getSeries(4),new Color(255,255,255)); setDisplay(getO1Title(),false); setDisplay(getY1Title(),false); setFillColor(getSeries(0),new Color(0,128,0)); setFillColor(getSeries(1),new Color(255,128,0)); *END ENDSTYLE END -*IA_GRAPH_FINISH -HTMLFORM BEGIN
<html>
<head>
</head>
<body>
<table border="0" cellpadding="0" cellspacing="0" style="border-collapse: collapse" width="100%">
<tr>
<td width="50%">!IBI.FIL.GRAPH1;</td>
<td width="50%">!IBI.FIL.GRAPH2;</td>
</tr>
</table>
</body>
</html>
-HTMLFORM END
The style of the first graph is suppose to be identical to the style of the second graph. 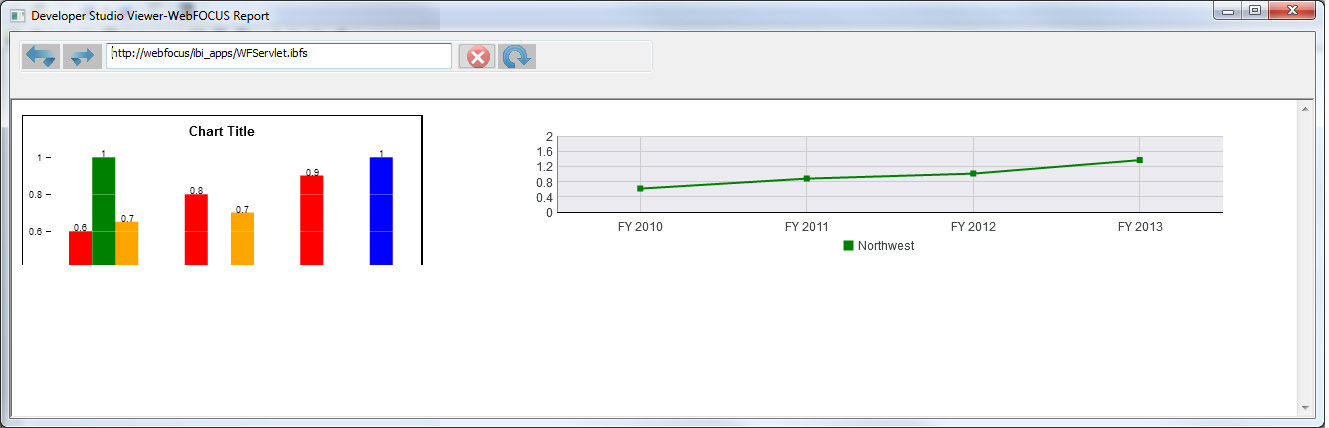 Any help is greatly appreciated! -EgonThis message has been edited. Last edited by: <Kathryn Henning>, WebFocus App Studio 8.1.0.5, Windows 7 64bit. | ||
|
| Guru |
From what I can tell you can't do two HTML5 graphs in one document. Using Developer Studio 1. Create two fex files one for each graph. 2. Create another fex file. Create with Composer. In Composer you can add the the two graphs. The output will be HTML graphs you won't get the animation. Using the Portal 1. Create a Document 2. InfoAssist should come up 3. Insert two Charts and build the graphs 4. You will notice HTML5 is greyed out Also try your solution above with HOLD FORMAT HTMTABLE and HOLD FORMAT HTML.This message has been edited. Last edited by: Mighty Max, WebFOCUS 8.1.05M Unix Self-Service/MRE/Report Caster - Outputs Excel, PDF, HTML, Flat Files | |||
|
| Expert |
Worked OK for me .... -SET &HoldType = 'HOLD';
-SET &Region = 'Northeast';
-INCLUDE chart1.fex
-RUN
-SET &Region = 'Southeast';
-INCLUDE chart1.fex
-RUN
-HTMLFORM BEGIN
<html>
<head>
</head>
<body>
<table border="0" cellpadding="0" cellspacing="0" style="border-collapse: collapse" width="100%">
<tr>
<td width="50%">!IBI.FIL.Northeast;</td>
<td width="50%">!IBI.FIL.Southeast;</td>
</tr>
</table>
</body>
</html>
-HTMLFORM END-* Repeatable chart focexec Chart1.fex -DEFAULTH &Region = 'Northeast' -DEFAULTH &HoldType = 'PCHOLD' DEFINE FILE GGSALES MONTH/Mt=GGSALES.SALES01.DATE; YEAR/YY=GGSALES.SALES01.DATE; END -*IA_GRAPH_BEGIN -*Do not delete or modify the comments below *-INTERNAL_COMMENT LINE#0 Removed to save screen width *-INTERNAL_COMMENT LINE#1 Removed to save screen width -*Do not delete or modify the comments above ENGINE INT CACHE SET ON GRAPH FILE GGSALES -* Created by Info Assist for Graph SUM GGSALES.SALES01.DOLLARS ACROSS GGSALES.SALES01.MONTH BY YEAR WHERE GGSALES.SALES01.REGION EQ '&Region'; ON GRAPH &HoldType.EVAL AS &Region.EVAL FORMAT JSCHART ON GRAPH SET VZERO OFF ON GRAPH SET HTMLENCODE ON ON GRAPH SET GRAPHDEFAULT OFF ON GRAPH SET HAXIS 700.0 ON GRAPH SET VAXIS 150.0 ON GRAPH SET GRMERGE ADVANCED ON GRAPH SET GRMULTIGRAPH 0 ON GRAPH SET GRLEGEND 1 ON GRAPH SET GRXAXIS 1 ON GRAPH SET LOOKGRAPH VLINE ON GRAPH SET STYLE * *GRAPH_SCRIPT setPieDepth(0); setPieTilt(0); setDepthRadius(0); setCurveFitEquationDisplay(false); setPlace(true); setUseSeriesShapes(true); setMarkerSizeDefault(50); *END INCLUDE=endeflt.sty,$ TYPE=REPORT, TITLETEXT=&WF_TITLE.QUOTEDSTRING, $ *GRAPH_SCRIPT setReportParsingErrors(false); setSelectionEnableMove(false); setFillColor(getSeries(2),new Color(237,186,4)); setTransparentBorderColor(getSeries(2), false); setTransparentBorderColor(getSeries(1), false); setBorderColor(getSeries(1),new Color(213,213,0)); setBorderColor(getSeries(0),new Color(191,0,0)); setFillColor(getSeries(4),new Color(217,0,0)); setBorderColor(getSeries(4),new Color(255,255,255)); setDisplay(getO1Title(),false); setDisplay(getY1Title(),false); setFillColor(getSeries(0),new Color(0,128,0)); setFillColor(getSeries(1),new Color(255,128,0)); *END ENDSTYLE END -RUN -*IA_GRAPH_FINISH Produces - 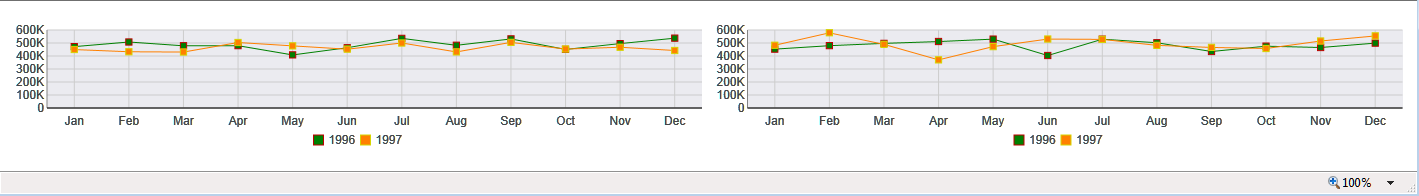 T
| |||||||||
|
| Guru |
I ran Tony's code against my localhost in Dev Studio and did not get the same results. I am using Dev Studio 8.0.7. Might be a bug in 8.0.7. Egon you can try opening a case and pass along this forum post and Tony's code.  WebFOCUS 8.1.05M Unix Self-Service/MRE/Report Caster - Outputs Excel, PDF, HTML, Flat Files | |||
|
| Gold member |
I have run it both ways now and I'm getting the same results at Max. I'm using 8.0.4 However, this only happen when I run the report stand alone, either from dev studio, or from the resource tree. When I place the report on an actual portal all charts display correctly. -Egon WebFocus App Studio 8.1.0.5, Windows 7 64bit. | |||
|
| Guru |
If you don't want to use the -HTMLFORM method, you can actually have two graphs in document composer with the HTML5 engine. Have your two graphs as AHTML graphs in two saperate reports and then put them into document composer with the overriding output format as Active Report. WebFOCUS 7.7.03/8.0.08 Dev Studio 7.7.03/8.0.08 App Studio 8.0.08 Windows 7 ALL Outputs | |||
|
| Master |
Egon- I obtained the same results as you, when I ran your code. I noticed that the code was giving the following error message when I looked at Programmer Tools (I'm on IE9.): HTML1113: Document mode restart from IE9 Standards to Quirks I added the DOCTYPE tag before the HTML tag, and now, with the HTML1113 error going away, both charts render. ... -HTMLFORM BEGIN <!DOCTYPE html> <html> ... -DaveThis message has been edited. Last edited by: David Briars,
| ||||
|

| Powered by Social Strata |
| Please Wait. Your request is being processed... |
Read-Only Topic WebFOCUS/FOCUS Forum on Focal Point | View $GS_USERNAME's Public Profile | |
| Add $GS_USERNAME to my Ignore List | |
| View Recent Posts by $GS_USERNAME | |
| Notify me of New Posts by $GS_USERNAME |