 |
|||||
|
As of December 1, 2020, Focal Point is retired and repurposed as a reference repository. We value the wealth of knowledge that's been shared here over the years. You'll continue to have access to this treasure trove of knowledge, for search purposes only. Join the TIBCO Community
Former myibi community members should have received an email on 8/3/22 to activate their user accounts to join the community. Check your Spam folder for the email. Please get in touch with us at community@tibco.com for further assistance. Reference the community FAQ to learn more about the community. | |||||
 WebFOCUS/FOCUS Forum on Focal Point Read-Only Topic
Go | Search | Notify | Tools |
| [SOLVED] Display aggregated field in header of multi-graph in InfoAssist | Login/Join |
| Member |
I am looking for a way to display aggregation in EACH header of a multi-graph chart in InfoAssist. Rather than a SUM or CNT of the total chart results, we would like each section of the multi-graph to SUM or CNT only the results for that section (by the multi-graph field). I have found that: 1. TOTCNT. 2. CNT. 3. SUM. A sample chart would use the following fields, formatted as a horizontal bar multi-graph with color by. Measure field = CNT.'Tickets' Multi-graph field = 'Work Group' Color by field = 'Ticket Status' sample image: [IMG:left] 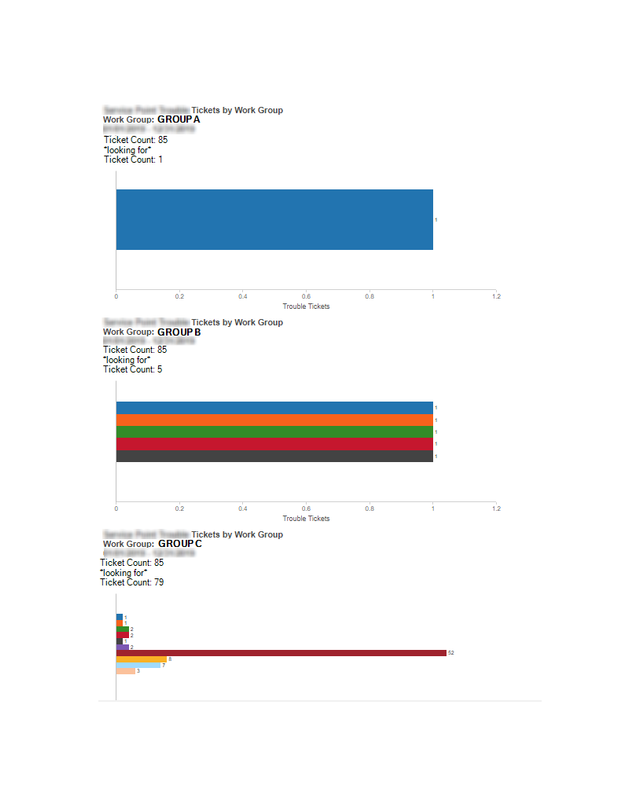 [/IMG] [/IMG] Data Work Groups: 3 total Group A, Group B, Group C Tickets: 85 total Group A = 1 ticket Group B = 5 tickets Group C = 79 tickets Ticket Status: 10 total Status 1, Status 2...Status 10 *tickets divided amongst multiple statuses per Work Group; please view image link aboveThis message has been edited. Last edited by: lsteff, WebFocus 8205 Linux Intel/AMD InfoAssist | ||
|
| Member |
The solution we discovered is to create a compute to use in the header. For a simple bar chart without color-by field, the solution was to create a 'c_cnt_tckt' compute with CNT.'Ticket' as the logic, then display c_cnt_tckt in the page header. For a bar chart with color-by field, the solution was to create a 'c_partition' compute with PARTITION_AGGR(CNT."Ticket", "Work Group", B, E, SUM ) as the logic, then display c_partition in the page header and hide it on the horizontal axis. [IMG:left]  [/IMG] [/IMG]WebFocus 8205 Linux Intel/AMD InfoAssist | |||
|
| Powered by Social Strata |
| Please Wait. Your request is being processed... |
Read-Only Topic WebFOCUS/FOCUS Forum on Focal Point | View $GS_USERNAME's Public Profile | |
| Add $GS_USERNAME to my Ignore List | |
| View Recent Posts by $GS_USERNAME | |
| Notify me of New Posts by $GS_USERNAME |