 |
|||||
|
As of December 1, 2020, Focal Point is retired and repurposed as a reference repository. We value the wealth of knowledge that's been shared here over the years. You'll continue to have access to this treasure trove of knowledge, for search purposes only. Join the TIBCO Community
Former myibi community members should have received an email on 8/3/22 to activate their user accounts to join the community. Check your Spam folder for the email. Please get in touch with us at community@tibco.com for further assistance. Reference the community FAQ to learn more about the community. | |||||
 WebFOCUS/FOCUS Forum on Focal Point Read-Only Topic
Go | Search | Notify | Tools |
| [SOLVED] Custom Visualization Help/Ideas | Login/Join |
| Member |
Hi, looking for ideas on creating a custom visualization on an HTML page which cannot be done with any wf charts out of the box. We are comparing 3 different items, which have been placed into quintiles based on a common metric over a population of like items, so each item (row) has a value of 1-5. We want to place each item along a line (x axis) that is divided from 1 to 5, and place a marker along the line at the appropriate value for each of the three items. The markers will have labels like "You", "Peers", "All Items" to show the end-user how they compare. The data look like: "Item Name","Quintile" "Item 1", 3 "Item 2", 4 "Item 3", 2 I tried adding a column and populating it with 0, and using that column as the Y axis value with a scatter plot, which results in each item plotted along the X axis. It kind of works, but the height of the scatter plot will not reduce enough to make it work regardless of the height value of the chart, and the markers don't offer enough customization to do what we want visually. Beyond that it looks like I may need to use a javascript library. I also was able to draw some SVG shapes within a wf report which may be an option. If anyone has any ideas or has done anything similar I would appreciate it! I've seen some clever hacks around here and I'm all for hacking! thanks- RyanThis message has been edited. Last edited by: <Kathryn Henning>, WF: WebFocus 8.0.02 InfoAssist, Dev Studio, Magnify, Portal/Dashboards, Mobile Favs Data: DB2 OS: Windows Output: Multiple | ||
|
| Member |
Thanks for the code, much appreciated. The markers are better, but I need all markers to be plotted along the X axis only, as if the Y axis value for all three was 0 (in reality there are no Y axis values, only X axis values) Sorry I would post a picture but my overlords block all cloud drive and photo/file sharing type websites so I can't upload an image file to the cloud and link to it here. WF: WebFocus 8.0.02 InfoAssist, Dev Studio, Magnify, Portal/Dashboards, Mobile Favs Data: DB2 OS: Windows Output: Multiple | |||
|
| Expert |
Taking the base from Nick and giving you a scatter plot (adjusted for minimal height) and you get the following. Not sure if it fits your need but it might give you more to begin plying? - ENGINE INT CACHE SET ON
GRAPH FILE CAR
SUM COMPUTE Compute_1/D2.1=0.65 ;
BY CAR.BODY.SEATS
ON GRAPH PCHOLD FORMAT JSCHART
ON GRAPH SET VZERO OFF
ON GRAPH SET HTMLENCODE ON
ON GRAPH SET GRAPHDEFAULT OFF
ON GRAPH SET HAXIS 770.0
ON GRAPH SET VAXIS 100.0
ON GRAPH SET GRMERGE ADVANCED
ON GRAPH SET GRMULTIGRAPH 0
ON GRAPH SET GRLEGEND 0
ON GRAPH SET GRXAXIS 1
ON GRAPH SET LOOKGRAPH SCATTERS
ON GRAPH SET STYLE *
*GRAPH_SCRIPT
setPieDepth(0);
setPieTilt(0);
setDepthRadius(0);
setCurveFitEquationDisplay(false);
setPlace(true);
setUseSeriesShapes(true);
setScaleMustIncludeZero(getX1Axis(), false);
setScaleMustIncludeZero(getY1Axis(), false);
setScaleMustIncludeZero(getY2Axis(), false);
setMarkerSizeDefault(60);
*END
INCLUDE=endeflt.sty,$
*GRAPH_SCRIPT
setReportParsingErrors(false);
setSelectionEnableMove(false);
setDisplay(getY1Label(),false);
setScaleMustIncludeZero(getX1Axis(),true);
setScaleMinAuto(getX1Axis(),false);
setScaleMaxAuto(getX1Axis(),false);
setScaleMax(getX1Axis(),6.0);
setGridStepAuto(getX1MajorGrid(),false);
setGridStep(getX1MajorGrid(),1.0);
setDisplay(getY1Title(),false);
setScaleMinAuto(getY1Axis(),false);
setScaleMaxAuto(getY1Axis(),false);
setScaleMax(getY1Axis(),1);
setScaleMin(getY1Axis(),0);
setDisplay(getY1MajorGrid(),false);
setDisplay(getDataText(),true);
setDataTextPosition(3);
setDataTextRadiusDefault(40);
setDataTextAngleDefault(155);
setReportParsingErrors(false);
setSelectionEnableMove(false);
setConnectLineMarkers(false);
setColorMode(2);
setMarkerShape(getSeries(0), 6);
setMarkerShape(getSeries(1), 12);
setMarkerShape(getSeries(2), 14);
setMarkerSizeDefault(140);
*END
*GRAPH_JS
dataLabels:{visible: true,
position: 'bottom',
formatCallback: function(v, s, g, data){
if (g === 0) { return 'You'; }
else if (g === 1) { return 'Peers'; }
else if (g === 2) { return 'All Items'; }
}},
series: [
{series: 'all', showDataValues: true},
]
*END
ENDSTYLE
END
-RUN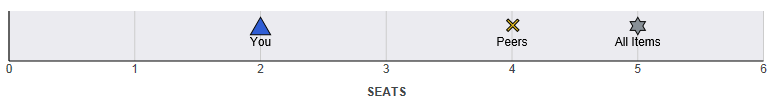 T
| |||||||||
|
| Member |
Thanks much! I can definitely work with this. I can see that I need to study the graph code much more and learn how to code graphs without the UI. Like most other things in webfocus it seems. WF: WebFocus 8.0.02 InfoAssist, Dev Studio, Magnify, Portal/Dashboards, Mobile Favs Data: DB2 OS: Windows Output: Multiple | |||
|
| Expert |
Ryan, People may find this hard to believe, but I used the GUI (App Studio as well (v8008) - honestly T p.s. The reason they might find it hard to believe this, is that I am known to avoid the GUI normally ... but times, they are a changin'
| |||||||||
|
| Powered by Social Strata |
| Please Wait. Your request is being processed... |
Read-Only Topic WebFOCUS/FOCUS Forum on Focal Point | View $GS_USERNAME's Public Profile | |
| Add $GS_USERNAME to my Ignore List | |
| View Recent Posts by $GS_USERNAME | |
| Notify me of New Posts by $GS_USERNAME |