 |
|||||
|
As of December 1, 2020, Focal Point is retired and repurposed as a reference repository. We value the wealth of knowledge that's been shared here over the years. You'll continue to have access to this treasure trove of knowledge, for search purposes only. Join the TIBCO Community
Former myibi community members should have received an email on 8/3/22 to activate their user accounts to join the community. Check your Spam folder for the email. Please get in touch with us at community@tibco.com for further assistance. Reference the community FAQ to learn more about the community. | |||||
 WebFOCUS/FOCUS Forum on Focal Point Read-Only Topic
Go | Search | Notify | Tools |
| [CLOSED] Trouble Understanding Graphs | Login/Join |
| Platinum Member |
I have run into a problem trying to create a graph using data in multiple fields. Hopefully I can illustrate what I have going on and someone more knowledgeable than me can grant some assistance. Here goes... My data that I want to plot exists in 6 different fields on my master file. ex. Field 1 - 25% Field 2 - 30% Field 3 - 16% Field 4 - 12% Field 5 - 9% Field 6 - 2% The data in these fields are percentages off a calculation that change every month. However, the only way I know what month they correspond to is the field itself. There is no associated date on the record. What I want to accomplish is a trending chart by using a line graph, but since my data is in multiple fields, I'm not sure how to plot it. Please help! I have tried dragging each field into the X-axis, Y-axis but that's not right. Can anyone educate me?This message has been edited. Last edited by: Kerry, WebFOCUS: 7702 O/S : Windows Data Migrator: 7702 | ||
|
| Virtuoso |
In order to get your line graph, you have to have all of your data in a single field and then use a sort value. That type of graph will not work for multiple fields. You could use a bar graph with a series as an alternative. The only other way would be to use the MacGuyver technique (for which there are multiple postings & examples on the forum) and some define statements to convert one record with multiple fields to multiple records of one field. I guess you could also create a hold file and then use an alternate master with an OCCURS= to emulate the existence of multiple records. Regards, Darin In FOCUS since 1991 WF Server: 7.7.04 on Linux and Z/OS, ReportCaster, Self-Service, MRE, Java, Flex Data: DB2/UDB, Adabas, SQL Server Output: HTML,PDF,EXL2K/07, PS, AHTML, Flex WF Client: 77 on Linux w/Tomcat | |||
|
| Expert |
It can be done... If THIS is what you want, then let me know. GRAPH FILE CAR SUM FLD1 FLD2 FLD3 FLD4 FLD5 ON GRAPH SET LOOKGRAPH VLINE ... END | |||
|
| Virtuoso |
Two ways to do it: EX -LINES 2 EDAPUT FOCTEMP,PETERS,CV,FILE
25 30 16 12 9 2
EX -LINES 9 EDAPUT MASTER,PETERS,CV,FILE
FILENAME=PETERS, SUFFIX=FIX,$
SEGNAME=ONE, SEGTYPE=S1 ,$
FIELD=FIELD1 ,ALIAS= ,D10 ,A4 ,$
FIELD=FIELD2 ,ALIAS= ,D10 ,A4 ,$
FIELD=FIELD3 ,ALIAS= ,D10 ,A4 ,$
FIELD=FIELD4 ,ALIAS= ,D10 ,A4 ,$
FIELD=FIELD5 ,ALIAS= ,D10 ,A4 ,$
FIELD=FIELD6 ,ALIAS= ,D10 ,A4 ,$
FILEDEF PETERS DISK PETERS.FTM (LRECL 24 RECFM V
GRAPH FILE PETERS
-* Created by Advanced Graph Assistant
SUM FIELD1 AS 'VAL 1'
FIELD2 AS 'VAL 2'
FIELD3 AS 'VAL 3'
FIELD4 AS 'VAL 4'
FIELD5 AS 'VAL 5'
FIELD6 AS 'VAL 6'
ON GRAPH PCHOLD AS HOLD FORMAT PNG
ON GRAPH SET HAXIS 770
ON GRAPH SET VAXIS 405
ON GRAPH SET UNITS PIXELS
ON GRAPH SET LOOKGRAPH VLINE
ON GRAPH SET GRAPHSTYLE *
setTemplateFile("/images/tdg/template/IBISouthWestern.txt");
setReportParsingErrors(false);
setSelectionEnableMove(false);
setUseSeriesShapes(true);
setMarkerSizeDefault(50);
setPlace(true);
setDepthRadius(0);
setDepthAngle(0);
ENDSTYLE
END
TABLE FILE PETERS
PRINT FIELD1 AS 'VAL 1'
OVER FIELD2 AS 'VAL 2'
OVER FIELD3 AS 'VAL 3'
OVER FIELD4 AS 'VAL 4'
OVER FIELD5 AS 'VAL 5'
OVER FIELD6 AS 'VAL 6'
ON TABLE SET PAGE OFF
ON TABLE HOLD AS VERT FORMAT WP
END
EX -LINES 6 EDAPUT MASTER,VERT,CV,FILE
FILENAME=VERT, SUFFIX=FIX,$
SEGNAME=ONE, SEGTYPE=S1 ,$
FIELD=DUMMY ,ALIAS= ,A2 ,A2 ,$
FIELD=FIELDNM ,ALIAS= ,A11 ,A11 ,$
FIELD=FIELDVAL ,ALIAS= ,D10 ,A10 ,$
FILEDEF VERT DISK VERT.WP (LRECL 23 RECFM V
GRAPH FILE VERT
-* Created by Advanced Graph Assistant
SUM FIELDVAL AS 'Percentage'
BY FIELDNM AS ' '
WHERE (FIELDNM NE ' ');
ON GRAPH PCHOLD AS HOLD FORMAT PNG
ON GRAPH SET HAXIS 770
ON GRAPH SET VAXIS 405
ON GRAPH SET UNITS PIXELS
ON GRAPH SET LOOKGRAPH VLINE
ON GRAPH SET GRMERGE ADVANCED
ON GRAPH SET GRMULTIGRAPH 0
ON GRAPH SET GRLEGEND 0
ON GRAPH SET GRXAXIS 1
ON GRAPH SET GRAPHSTYLE *
setTemplateFile("/images/tdg/template/IBISouthWestern.txt");
setReportParsingErrors(false);
setSelectionEnableMove(false);
setUseSeriesShapes(true);
setMarkerSizeDefault(50);
setPlace(true);
setDepthRadius(0);
setDepthAngle(0);
ENDSTYLE
END
Hope this helps ... GamP
| |||||||||
| ||||||||||

| Expert |
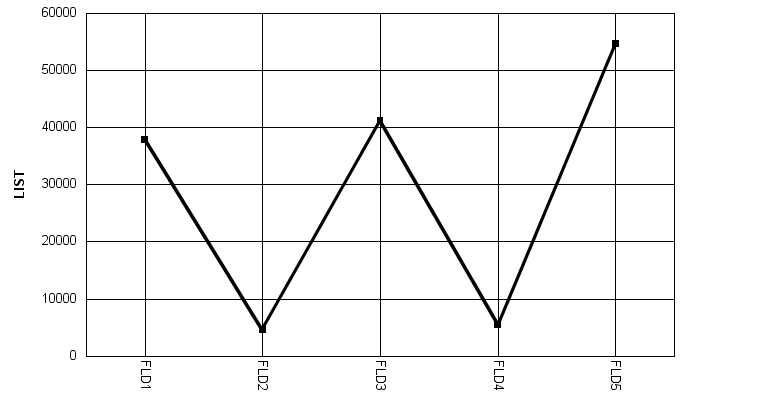
T.Peters, GamP showed one way of doing it that may work for you. Here's what I did: -* File graph_multiple_fields.fex -* July 10 2009: Created by Douglas Lee, Senior WebFOCUS Consultant -* http://forums.informationbuild...71057331/m/824109571 DEFINE FILE CAR FLD1/D12 = IF COUNTRY EQ 'ENGLAND' THEN DCOST ELSE 0; FLD2/D12 = IF COUNTRY EQ 'FRANCE' THEN DCOST ELSE 0; FLD3/D12 = IF COUNTRY EQ 'ITALY' THEN DCOST ELSE 0; FLD4/D12 = IF COUNTRY EQ 'JAPAN' THEN DCOST ELSE 0; FLD5/D12 = IF COUNTRY EQ 'W GERMANY' THEN DCOST ELSE 0; END GRAPH FILE CAR SUM FLD1 FLD2 FLD3 FLD4 FLD5 ON GRAPH SET LOOKGRAPH VLINE ON GRAPH SET GRAPHEDIT SERVER ON GRAPH SET BARNUMB OFF ON GRAPH SET 3D OFF ON GRAPH SET VZERO OFF ON GRAPH SET GRID ON ON GRAPH PCHOLD FORMAT PNG ON GRAPH SET GRAPHSTYLE * setMarkerDisplay(true); setConnectLineMarkers(true); setConnectScatterMarkers(true); setO1LabelDisplay(true); setO1AxisSide(0); setO1MajorGridDisplay(true); setO1MajorGridStyle(0); setO1MinorGridDisplay(false); setAxisAssignment(0,0); setAxisAssignment(1,0); setAxisAssignment(2,0); setAxisAssignment(3,0); setAxisAssignment(4,0); setY1LabelDisplay(true); setY1AxisSide(0); setY1MajorGridDisplay(true); setY1MajorGridStyle(0); setY1MinorGridDisplay(false); setTextFormatPreset(getY1Label(),-1); setTextFormatPattern(getY1Label(),"#.##"); setPieFeelerTextDisplay(1); setPieLabelDisplay(0); setTextFormatPreset(getPieSliceLabel(),1); setRiserBorderMode(1); setSeriesDefaultTransparentBorderColor(true); setUseSeriesBorderDefaults(true); setLegendDisplay(false); setFontSizeAbsolute(getY1Title(),true); setFontSizeAbsolute(getY1Label(),true); setFontSizeAbsolute(getY2Title(),true); setFontSizeAbsolute(getY2Label(),true); setFontSizeAbsolute(getO1Title(),true); setPlace(true); ENDSTYLE ON GRAPH SET STYLE * SQUEEZE=ON, ORIENTATION=PORTRAIT,$ TYPE=REPORT, GRID=OFF, FONT='TIMES NEW ROMAN', SIZE=10,$ TYPE=DATA, COLOR='BLACK',$ ENDSTYLE ENDI hope this helps to shed some light into your learning experience. -Doug
| |||||
|
| Platinum Member |
Doug, this is great, thank you so much. I'll try it out and see if I can get it to work. If it's not too much trouble, though, could you explain what you're doing here? I'm not a FOCUS programmer and I'm pretty novice to the code aspect of this stuff. I understand the DEFINES area...you're setting up 5 work fields to report on? Now, if I already have the data in fields, do I need to do that? Can I just skip to the SUM area? Other areas I can understand, the "ON GRAPH PCHOLD FORMAT", "GRAPHSTYLE", "TYPE" and "ENDSTYLE". Can you give a cursory explanation of these different set methods? WebFOCUS: 7702 O/S : Windows Data Migrator: 7702 | |||
|
| Virtuoso |
If you already have the fields available, you can just skip the define part. The set methods you refer to are so-called graph api commands, that control the look of the graph. Most of these API commands will be generated by the graph wizard, although you could add or alter some of them manually. You would have to know what the do ... but there is a manual that describes them all. GamP
| |||||||||
| ||||||||||
| Powered by Social Strata |
| Please Wait. Your request is being processed... |
Read-Only Topic WebFOCUS/FOCUS Forum on Focal Point | View $GS_USERNAME's Public Profile | |
| Add $GS_USERNAME to my Ignore List | |
| View Recent Posts by $GS_USERNAME | |
| Notify me of New Posts by $GS_USERNAME |