 |
|||||
|
As of December 1, 2020, Focal Point is retired and repurposed as a reference repository. We value the wealth of knowledge that's been shared here over the years. You'll continue to have access to this treasure trove of knowledge, for search purposes only. Join the TIBCO Community
Former myibi community members should have received an email on 8/3/22 to activate their user accounts to join the community. Check your Spam folder for the email. Please get in touch with us at community@tibco.com for further assistance. Reference the community FAQ to learn more about the community. | |||||
 WebFOCUS/FOCUS Forum on Focal Point Read-Only Topic
Go | Search | Notify | Tools |
| [SOLVED] embedded graphtype - controlling the scale | Login/Join |
| Gold member |
I search and read lots of posts and I want to find out if it's possible to control the scale of an embedded graph (data visualization in a report). I have a percent complete column and I want the bar to represent % complete. Right now I have the bar graph working but if seems to register it's length in comparisons with other rows, not the 100% scale. Hope this makes sense. Thanks, --wgThis message has been edited. Last edited by: Kerry, WF 8009m, Clustered vm Windows2008r2 reporting servers; Web interface: tomcat; Output: EXCEL, HTML, PDF; dbms: Oracle 10, db2 on mvs, mssql | ||
|
| Expert |
It sounds like you want to add a column within your report which is actually a horizontal bar graph, right? IF so THEN check out "visualization" ELSE please elaborate (preferably using an example with the CAR file).
| |||||
|
| Gold member |
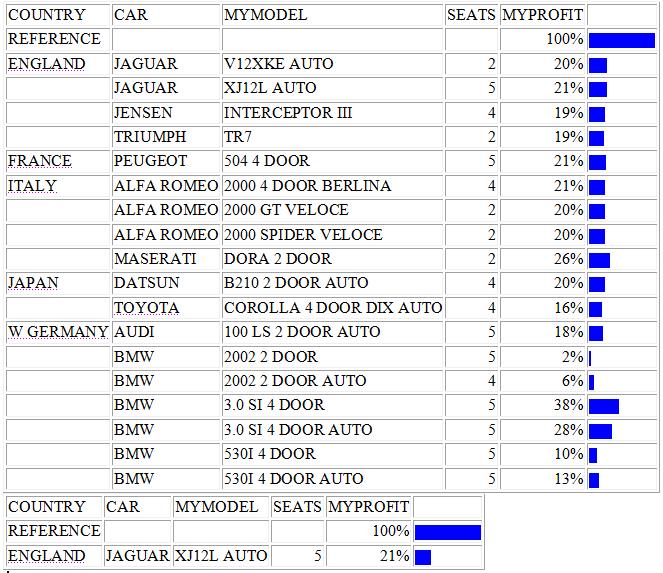
--Thanks Doug The following code hopefully, will explain better. Please note the size difference on the BMW 2002 2 DOOR (2%) on each report. I need the blue bar graph when full to represent 100% regardless of 1 record or 100 records. TABLE FILE CAR PRINT CAR MODEL SEATS COMPUTE PROFIT/D12% = (RCOST - DCOST)/DCOST*100; BY COUNTRY ON TABLE SET STYLE * GRAPHTYPE=DATA, COLUMN=PROFIT, GRAPHCOLOR=BLUE, $ ENDSTYLE ON TABLE HOLD AS WDG1 FORMAT HTMTABLE END TABLE FILE CAR PRINT CAR MODEL SEATS COMPUTE PROFIT/D12% = (RCOST - DCOST)/DCOST*100; BY COUNTRY IF CAR EQ 'BMW' IF MODEL EQ '2002 2 DOOR' ON TABLE SET STYLE * GRAPHTYPE=DATA, COLUMN=PROFIT, GRAPHCOLOR=BLUE, $ ENDSTYLE ON TABLE HOLD AS WDG2 FORMAT HTMTABLE END -HTMLFORM BEGIN
-HTMLFORM END WF 8009m, Clustered vm Windows2008r2 reporting servers; Web interface: tomcat; Output: EXCEL, HTML, PDF; dbms: Oracle 10, db2 on mvs, mssql | |||||
|
| Expert |
I don't have time to work out all the code. But, I do have time to pass this thought on to you and hope you can take it from here. Consider adding another row to your table called (something like) REFERENCE (probably with the MyGyver Technique). Use the same format as your PROFIT field with a value of 100%. Use that as your first row in your report. Something Like This. I hope this helps... | |||
|
| Expert |
Don't forget the developer center tips and techniques page where you will find this article by Susannah that will probably help you in your quest. T
| |||||||||
|
| Gold member |
Thanks Tony A, purrfect. I wasn't aware of Susannah's article and it's perfect. Thanks again --wg WF 8009m, Clustered vm Windows2008r2 reporting servers; Web interface: tomcat; Output: EXCEL, HTML, PDF; dbms: Oracle 10, db2 on mvs, mssql | |||
|
| Powered by Social Strata |
| Please Wait. Your request is being processed... |
Read-Only Topic WebFOCUS/FOCUS Forum on Focal Point | View $GS_USERNAME's Public Profile | |
| Add $GS_USERNAME to my Ignore List | |
| View Recent Posts by $GS_USERNAME | |
| Notify me of New Posts by $GS_USERNAME |