I usually work in App Studio but am now working out of Dev Studio. I have a county map that has a large disparity between the lower values and the upper values. Because of the disparity the majority of my map is one color. I'd like to be able to set the colors for the various values. I've researched the Knowledge Base and found something that fits my need, however the code isn't working. Being new to JS I'm sure it's a rookie mistake; I just need an expert eye on it to point me in the right direction. Here's the original code that works:
8.2.02M (production), 8.2.02M (test), Windows 10, all outputs.
September 03, 2015, 12:13 PM
Pondog
Thanks, CoolGuy, for the tip. It worked, to an extent. I was able to get the map back up but my color scheme is still not showing the variety I'm seeking. I'm not sure if I'm not using the correct commands or what. I'm going to do some more research and work with it a bit. Below is the code I ended up with. Thanks again!
- FOCUS Man, just FOCUS! ----------------------------- Product: WebFOCUS Version: 8.1.04 Server: Windows 2008 Server
September 03, 2015, 05:21 PM
Pondog
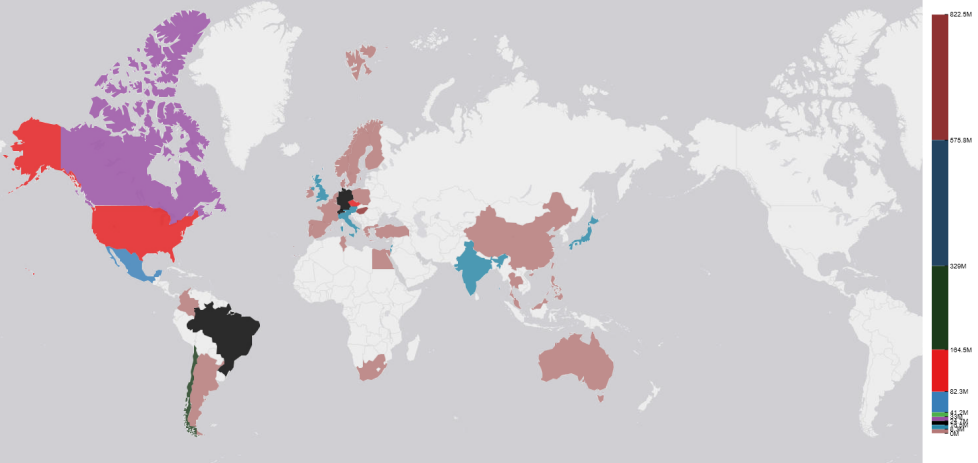
Thanks, GavinL. I checked though the links you offered and even found a few others talking about colors in choropleth charts, color bands, discrete sets, etc. It seems as though, with the previous code, as well as the code below, DS is returning a default color scheme going from cream-yellow up to dark-blue. Since I'm looking at various areas in my county map, and the areas have different ranges within each area, it made more sense to go with a percentage approach than a hard-coded figure. Here's what I'm working with; again, it runs, but I get a default color scheme.
Drop the "heatmapProperties" and loose the double quotes around the properties key words - only use them on the values -
ENGINE INT CACHE SET ON
-DEFAULTH &WF_STYLE_UNITS='PIXELS';
-DEFAULTH &WF_STYLE_HEIGHT='405.0';
-DEFAULTH &WF_STYLE_WIDTH='770.0';
-DEFAULTH &WF_TITLE='WebFOCUS Report';
GRAPH FILE wf_retail
-* Created by Info Assist for Graph
SUM WF_RETAIL.WF_RETAIL_SALES.GROSS_PROFIT_LOCAL
BY WF_RETAIL.WF_RETAIL_GEOGRAPHY_CUSTOMER.COUNTRY_NAME
ON GRAPH PCHOLD FORMAT JSCHART
ON GRAPH SET VZERO OFF
ON GRAPH SET HTMLENCODE ON
ON GRAPH SET GRAPHDEFAULT OFF
ON GRAPH SET GRWIDTH 1
ON GRAPH SET UNITS &WF_STYLE_UNITS
ON GRAPH SET HAXIS &WF_STYLE_WIDTH
ON GRAPH SET VAXIS &WF_STYLE_HEIGHT
ON GRAPH SET GRMERGE ADVANCED
ON GRAPH SET GRMULTIGRAPH 0
ON GRAPH SET GRLEGEND 0
ON GRAPH SET GRXAXIS 1
ON GRAPH SET LOOKGRAPH CHOROPLETH
ON GRAPH SET AUTOFIT ON
ON GRAPH SET STYLE *
*GRAPH_SCRIPT
setPieDepth(0);
setPieTilt(0);
setDepthRadius(0);
setCurveFitEquationDisplay(false);
setPlace(true);
setPlace(true); setToolTipStyle("html5");
*END
INCLUDE=endeflt.sty,$
TYPE=REPORT, TITLETEXT=&WF_TITLE.QUOTEDSTRING, $
*GRAPH_SCRIPT
setReportParsingErrors(false);
setSelectionEnableMove(false);
setDisplay(getLegendArea(),true);
*GRAPH_JS
mapProperties: {
    leaflet: {
        overlayLayers: [{
                title: "World",
                dataLookup: "properties.country_name",
                layerInfo: {
                    type: "countries"
                },
                type: "tdg",
                url: function(){ return tdgchart.getScriptPath() + 'map/world.json'}
            }],
        baselayers: [{
                title: "ArcGIS_World_Street_Map",
                layerInfo: {
                    maxZoom: 16,
                    attribution: function() { return "&|copy; <a target='_blank' href='http://www.InformationBuilders.com'>Information Builders</a> | Map Tiles: &|copy; Esri"; }
                },
                url: function() { return 'http://services.arcgisonline.com/ArcGIS/rest/services/Canvas/World_Light_Gray_Base/MapServer/tile/{z}/{y}/{x}'; }
            }]
    }
}
,
colorScale: {
  colorMode:{mode: "discrete"},
  colorBands: [
	{start:"0%",  stop:"1%",   color:"#B57877"},
	{start:"1%",  stop:"2%",   color:"#2887A6"},
	{start:"2%",  stop:"3%",   color:"FF7F00"},
	{start:"3%",  stop:"4%",   color:"#984EA3"},
	{start:"4%",  stop:"5%",  color:"#4DAF4A"},
	{start:"5%",  stop:"10%",  color:"#377EB8"},
	{start:"10%", stop:"30%",  color:"#E41A1C"},
	{start:"30%", stop:"50%",  color:"#1B3B1A"},
	{start:"50%", stop:"80%",  color:"#224461"},
	{start:"80%", stop:"100%", color:"#8F3131"}
 ]
},

*END
ENDSTYLE
END
-RUN
T
Edited: BTW, you might want to talk to Porter about your colour palette!
In FOCUS since 1986
WebFOCUS Server 8.2.01M, thru 8.2.07 on Windows Svr 2008 R2
WebFOCUS App Studio 8.2.06 standalone on Windows 10
September 04, 2015, 09:49 AM
Pondog
Hey Tony, Thanks for the code. I made the suggested changes and still end up with the default colorscheme and no breakdown or bands. I get the same result if I remove the colorScale block of code all together. I'm wondering if I may have something in my code that's causing an override or a conflict. I'm posting it in hopes of finding where I'm erring. Naturally, being new to the whole WF experience, I'll gladly take any hints tips or tricks regrading the code.
TABLE FILE VIEW_BDCHDET -* NEEDS WHERE STMTS USED IN DASHBOARD SUM &MEASURE_NM BY LOWEST FIPSCODE BY COUNTYNAM BY DF_REGION WHERE &MEASURE_NM NE 0 WHERE VIEW_BDCHDET.BDCHDET.PSTPDFY EQ &FISCALYR WHERE VIEW_BDCHDET.BDCHDET.ORG EQ '&ORG.(FIND ORGSELECT.ORGSELECT.ORG,ORGSELECT.ORGSELECT.ORG IN orgselect).ORG:.'; WHERE VIEW_BDCHDET.BDCHDET.DEPARTMENT EQ &DEPARTMENT.(FIND ORGSELECT.ORGSELECT.DEPARTMENT,ORGSELECT.ORGSELECT.DEPTDESC IN orgselect).DEPARTMENT.; WHERE VIEW_BDCHDET.BDCHDET.DIVISION EQ &DIVISION.(FIND ORGSELECT.ORGSELECT.DIVISION,ORGSELECT.ORGSELECT.DIVDESC IN orgselect).DIVISION.; WHERE VIEW_BDCHDET.BDCHDET.BILAREA EQ &BILAREA.(FIND ORGSELECT.ORGSELECT.BILAREA,ORGSELECT.ORGSELECT.BADESC IN orgselect).BILAREA.; WHERE VIEW_BDCHDET.BDCHDET.BILPROV EQ &BILPROV.(FIND ORGSELECT.ORGSELECT.BILPROV,ORGSELECT.ORGSELECT.PROVNAME IN orgselect).BILPROV.; WHERE VIEW_BDCHDET.LOCATIONS.LOCCAT2 EQ &LOCCAT2.(FIND ORGSELECT.ORGSELECT.LOCCAT2,ORGSELECT.ORGSELECT.LOCCAT2DES IN orgselect).LOCCAT2.; WHERE VIEW_BDCHDET.BDCHDET.OTHERFSC EQ &INOUTPAT.(FIND ORGSELECT.ORGSELECT.LOCCAT,ORGSELECT.ORGSELECT.LOCCATDESC IN orgselect).INOUTPAT.; WHERE VIEW_BDCHDET.BDCHDET.LOCATION EQ &LOCATN.(FIND ORGSELECT.ORGSELECT.LOCNUM,ORGSELECT.ORGSELECT.LOCDESC IN orgselect).LOCATN.; WHERE DF_REGIONI EQ ®ION ON TABLE SET PAGE-NUM NOLEAD ON TABLE NOTOTAL ON TABLE HOLD AS H1 ON TABLE SET HTMLCSS ON ON TABLE SET STYLE * INCLUDE = IBFS:/EDA/EDASERVE/_EDAHOME/ETC/endeflt.sty, $ ENDSTYLE END -RUN -IF &LINES EQ 0 THEN GOTO NODATA; -*IA_GRAPH_BEGIN -*Do not delete or modify the comments below *-INTERNAL_COMMENT LINE#0$PD94bWwgdmVyc2lvbj0iMS4wIiBlbmNvZGluZz0iVVRGLTgiPz48IS0tMS4wLS0+PFJvb3QgdmVyc2lvbj0iMS4wIj4KICAgIDxPYmplY3Qgb2JqZWN0SWQ9IkNoYXJ0XzEiPgogICAgICAgIDxQcm9wZXJ0eSBuYW1lPSJMaW5rZWRTb3J0cyIgdHlwZT0iamF2YS5sYW5nLlN0cmluZyIvPgogICAgPC9PYmplY3Q+CiAgICA8T2JqZWN0IG9iamVjdElkPSJHTE9CQUwiPgogICAgICAgIDxQcm9wZXJ0eSBuYW1lPSJTYW1wbGVEYXRhIiB0eXBlPSJqYXZhLmxhbmcuQm9vbGVhbiI+ZmFsc2U8L1Byb3BlcnR5PgogICAgICAgIDxQcm9wZXJ0eSBuYW1lPSJHbG9iYWxSZWNvcmRMaW1pdCIgdHlwZT0iamF2YS5sYW5nLlN0cmluZyI+NTAwPC9Qcm9wZXJ0eT4KICAgICAgICA8UHJvcGVydHkgbmFtZT0iR2xvYmFsUnVuUmVjb3JkTGltaXQiIHR5cGU9ImphdmEubGFuZy5TdHJpbmciPjA8L1Byb3BlcnR5PgogICAgICAgIDxQcm9wZXJ0eSBuYW1lPSJmaWVsZERpc3BsYXlNb2RlIiB0eXBlPSJqYXZhLmxhbmcuU3RyaW5nIj5sYWJlbDwvUHJvcGVydHk+CiAgICAgICAgPFByb3BlcnR5IG5hbWU9InByZWZpeERpc3BsYXlNb2RlIiB0eXBlPSJqYXZhLmxhbmcuU3RyaW5nIi8+CiAgICAgICAgPFByb3BlcnR5IG5hbWU9IkFjdGl2ZV9TdHlsZV9Vc2VyX3R5cGUiIHR5cGU9ImphdmEubGFuZy5TdHJpbmciPnBvd2VyPC9Qcm9wZXJ0eT4KICAgICAgICA8UHJvcGVydHkgbmFtZT0iR2xvYmFsVmFsdWVzUGFnaW5nIiB0eXBlPSJqYXZhLmxhbmcuU3RyaW5nIj40PC9Qcm9wZXJ0eT4KICAgICAgICA8UHJvcGVydHkgbmFtZT0iRm9jZXhlY1ByZWZlcmVuY2VzIiB0eXBlPSJNYXAiPgogICAgICAgICAgICA8RW50cnkga2V5PSJkZWZhdWx0X2NvbXBvc2VfZm9ybWF0IiB0eXBlPSJqYXZhLmxhbmcuU3RyaW5nIj5QREY8L0VudHJ5PgogICAgICAgICAgICA8RW50cnkga2V5PSJkaXNwbGF5SW50ZXJhY3RpdmVNb2RlSW5mb01pbmlQcmVmZXJlbmNlIiB0eXBlPSJqYXZhLmxhbmcuU3RyaW5nIj50cnVlPC9FbnRyeT4KICAgICAgICAgICAgPEVudHJ5IGtleT0iZGlzcGxheUxheW91dFRhYkluZm9NaW5pUHJlZmVyZW5jZSIgdHlwZT0iamF2YS5sYW5nLlN0cmluZyI+ZmFsc2U8L0VudHJ5PgogICAgICAgICAgICA8RW50cnkga2V5PSJkaXNwbGF5RGF0YVRhYkluZm9NaW5pUHJlZmVyZW5jZSIgdHlwZT0iamF2YS5sYW5nLlN0cmluZyI+ZmFsc2U8L0VudHJ5PgogICAgICAgICAgICA8RW50cnkga2V5PSJkaXNwbGF5UXVpY2tBY2Nlc3NUb29sYmFyU2F2ZUluZm9NaW5pUHJlZmVyZW5jZSIgdHlwZT0iamF2YS5sYW5nLlN0cmluZyI+dHJ1ZTwvRW50cnk+CiAgICAgICAgICAgIDxFbnRyeSBrZXk9ImRpc3BsYXlTbGljZXJzVGFiRWRpdEluZm9NaW5pUHJlZmVyZW5jZSIgdHlwZT0iamF2YS5sYW5nLlN0cmluZyI+ZmFsc2U8L0VudHJ5PgogICAgICAgICAgICA8RW50cnkga2V5PSJpbmZvQXNzaXN0TW9kZUFsbG93ZWRJbmZvTWluaVByZWZlcmVuY2UiIHR5cGU9ImphdmEubGFuZy5TdHJpbmciPmZhbHNlPC9FbnRyeT4KICAgICAgICAgICAgPEVudHJ5IGtleT0iZGlzcGxheUVkaXRNb2RlSW5mb01pbmlQcmVmZXJlbmNlIiB0eXBlPSJqYXZhLmxhbmcuU3RyaW5nIj5mYWxzZTwvRW50cnk+CiAgICAgICAgICAgIDxFbnRyeSBrZXk9ImRlZmF1bHRfcHJldmlld19wYWdlbGltaXRfbGF5b3V0IiB0eXBlPSJqYXZhLmxhbmcuU3RyaW5nIj4xPC9FbnRyeT4KICAgICAgICAgICAgPEVudHJ5IGtleT0icnVuT25TdGFydHVwSW5mb01pbmlQcmVmZXJlbmNlIiB0eXBlPSJqYXZhLmxhbmcuU3RyaW5nIj50cnVlPC9FbnRyeT4KICAgICAgICAgICAgPEVudHJ5IGtleT0iZGlzcGxheUhvbWVUYWJJbmZvTWluaVByZWZlcmVuY2UiIHR5cGU9ImphdmEubGFuZy5TdHJpbmciPmZhbHNlPC9FbnRyeT4KICAgICAgICAgICAgPEVudHJ5IGtleT0iZGVmYXVsdF9wcmV2aWV3X3BhZ2VsaW1pdCIgdHlwZT0iamF2YS5sYW5nLlN0cmluZyI+NTwvRW50cnk+CiAgICAgICAgICAgIDxFbnRyeSBrZXk9ImRpc3BsYXlJbnNlcnRUYWJJbmZvTWluaVByZWZlcmVuY2UiIHR5cGU9ImphdmEubGFuZy5TdHJpbmciPmZhbHNlPC9FbnRyeT4KICAgICAgICAgICAgPEVudHJ5IGtleT0iZGlzcGxheUZvcm1hdFRhYkluZm9NaW5pUHJlZmVyZW5jZSIgdHlwZT0iamF2YS5sYW5nLlN0cmluZyI+dHJ1ZTwvRW50cnk+CiAgICAgICAgICAgIDxFbnRyeSBrZXk9ImRpc3BsYXlTZXJpZXNUYWJJbmZvTWluaVByZWZlcmVuY2UiIHR5cGU9ImphdmEubGFuZy5TdHJpbmciPmZhbHNlPC9FbnRyeT4KICAgICAgICAgICAgPEVudHJ5IGtleT0ibWV0YWRhdGFfdmlld3MiIHR5cGU9ImphdmEubGFuZy5TdHJpbmciPk1ldGFEYXRhVHJlZS5WSUVXX0RJTVM8L0VudHJ5PgogICAgICAgICAgICA8RW50cnkga2V5PSJkaXNwbGF5U2xpY2Vyc1RhYkludGVyYWN0aXZlSW5mb01pbmlQcmVmZXJlbmNlIiB0eXBlPSJqYXZhLmxhbmcuU3RyaW5nIj50cnVlPC9FbnRyeT4KICAgICAgICAgICAgPEVudHJ5IGtleT0iZGlzcGxheVJlc291cmNlc0ZpZWxkVGFiSW5mb01pbmlQcmVmZXJlbmNlIiB0eXBlPSJqYXZhLmxhbmcuU3RyaW5nIj5mYWxzZTwvRW50cnk+CiAgICAgICAgPC9Qcm9wZXJ0eT4KICAgICAgICA8UHJvcGVydHkgbmFtZT0iY2FzY2FkZU5hbWVzIiB0eXBlPSJNYXAiLz4KICAgICAgICA8UHJvcGVydHkgbmFtZT0iTWFzdGVyX0ZpbGVzIiB0eXBlPSJTZXQiPgogICAgICAgICAgICA8RW50cnkgdHlwZT0iamF2YS5sYW5nLlN0cmluZyI+SDE8L0VudHJ5PgogICAgICAgIDwvUHJvcGVydHk+CiAgICAgICAgPFByb3BlcnR5IG5hbWU9Im1ldGFkYXRhVmlld0FzIiB0eXBlPSJNYXAiPgogICAgICAgICAgICA8RW50cnkga2V5PSJIMSIgdHlwZT0iamF2YS5sYW5nLlN0cmluZyI+TWV0YURhdGFUcmVlLlZJRVdfRElNUzwvRW50cnk+CiAg *-INTERNAL_COMMENT LINE#1$ICAgICAgPC9Qcm9wZXJ0eT4KICAgICAgICA8UHJvcGVydHkgbmFtZT0iZW5hYmxlUHJldmlldyIgdHlwZT0iamF2YS5sYW5nLkJvb2xlYW4iPnRydWU8L1Byb3BlcnR5PgogICAgPC9PYmplY3Q+CjwvUm9vdD4= -*Do not delete or modify the comments above ENGINE INT CACHE SET ON -DEFAULTH &WF_STYLE_UNITS='PIXELS'; -DEFAULTH &WF_STYLE_HEIGHT='310.0'; -DEFAULTH &WF_STYLE_WIDTH='680.0'; GRAPH FILE H1 -* Created by Info Assist for Graph SUM &MEASURE_NM BY H1.H1.FIPSCODE ON GRAPH PCHOLD FORMAT JSCHART ON GRAPH SET VZERO OFF ON GRAPH SET HTMLENCODE ON ON GRAPH SET EMBEDHEADING ON ON GRAPH SET GRAPHDEFAULT OFF ON GRAPH SET GRWIDTH 1 ON GRAPH SET UNITS &WF_STYLE_UNITS ON GRAPH SET HAXIS &WF_STYLE_WIDTH ON GRAPH SET VAXIS &WF_STYLE_HEIGHT ON GRAPH SET GRMERGE ADVANCED ON GRAPH SET GRMULTIGRAPH 0 ON GRAPH SET GRLEGEND 0 ON GRAPH SET GRXAXIS 1 ON GRAPH SET LOOKGRAPH CHOROPLETH ON GRAPH SET AUTOFIT ON ON GRAPH SET STYLE * *GRAPH_SCRIPT setPieDepth(0); setPieTilt(0); setDepthRadius(0); setCurveFitEquationDisplay(false); setPlace(true); setPlace(true); setToolTipStyle("html5"); *END INCLUDE=IBFS:/FILE/IBI_HTML_DIR/javaassist/intl/EN/ENIADefault_combine.sty,$ TYPE=REPORT, TITLETEXT='WebFOCUS Report', $ *GRAPH_SCRIPT setPlace(true); setToolTipStyle("html5"); setPlace(true); setToolTipStyle("html5"); setReportParsingErrors(false); setSelectionEnableMove(false); setDisplay(getLegendArea(),true); *GRAPH_JS
*END ENDSTYLE END -*IA_GRAPH_FINISH -GOTO HASDATA -NODATA -HTMLFORM BEGIN
"There is no data available for this selection." -HTMLFORM END -HASDATA
Thanks a bunch! Tony
WebFOCUS 8.1.05 Windows, All Outputs
September 04, 2015, 10:06 AM
Pondog
As a note: I did remove the double quotes from around the key words and ran it as recommended by Tony.
WebFOCUS 8.1.05 Windows, All Outputs
September 04, 2015, 10:53 AM
Tony A
quote:
"dataLookup": "properties.county_fips",
This doesn't match your BY field unless it's the alias?
The styling is perfectly OK and produces the expected output (still not keen on the colours ) in either content or apps folders.
T
In FOCUS since 1986
WebFOCUS Server 8.2.01M, thru 8.2.07 on Windows Svr 2008 R2
WebFOCUS App Studio 8.2.06 standalone on Windows 10
September 04, 2015, 12:28 PM
Pondog
Hey Tony, I'm able to get the map to come up and I can select a county and see the underlying values, it's just the coloring that isn't working out.
I'm not quite sure about your "alias" statement. I know what an alias is, but I'm not sure what you're describing. If I go with the initial code at the beginning of this post I can get the different colors for the different counties; unfortunately there's no distinction in the lower values.