 |
|||||
|
As of December 1, 2020, Focal Point is retired and repurposed as a reference repository. We value the wealth of knowledge that's been shared here over the years. You'll continue to have access to this treasure trove of knowledge, for search purposes only. Join the TIBCO Community
Former myibi community members should have received an email on 8/3/22 to activate their user accounts to join the community. Check your Spam folder for the email. Please get in touch with us at community@tibco.com for further assistance. Reference the community FAQ to learn more about the community. | |||||
 Read-Only Topic
Go  | Search  | Notify  | Tools  |
| Silver Member |
I want to visualize ROW-TOTAL in the example below, is it possible? TABLE FILE CAR SUM CNT.SALES AS 'Count' BY COUNTRY AS '' ACROSS CAR AS '' ON TABLE ROW-TOTAL AS 'TOTAL' ON TABLE SUB-TOTAL AS 'TOTAL' END Any help is appreciated. WebFOCUS 8.2.05 Windows 2003 Excel, HTML, PDF | ||
|
| Expert |
Hi JJ, Can you please explain what you mean by "visualize"? Our expert ran the code and it works just fine. Can you please be a little more specific about what you want/need? Cheers, Kerry Kerry Zhan Focal Point Moderator Information Builders, Inc. | |||
|
| Expert |
I think JJ means "Formatting Data Visualization Bar Graphs" but I don't think it can be done with row totals. If those row totals were real columns then perhaps it could be done. Francis Give me code, or give me retirement. In FOCUS since 1991 Production: WF 7.7.05M, Dev Studio, BID, MRE, WebSphere, DB2 / Test: WF 8.1.05M, App Studio, BI Portal, Report Caster, jQuery, HighCharts, Apache Tomcat, MS SQL Server | |||
|
| Silver Member |
Yes, I meant Data Visualization Bar Graphs for row totals. Row totals were not real columns. Thanks to both of you. WebFOCUS 8.2.05 Windows 2003 Excel, HTML, PDF | |||
|
| Expert |
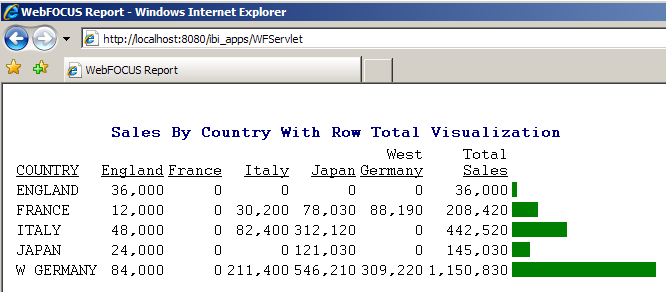
JJ, is THIS what you're looking to achieve? If so, based on the CAR file, you can do it by calculating a "xx_SALES" field for each "COUNTRY", i.e.: EN_SALES for ENGLAND SALES, etc... and a TotalSales field which is a TOTAL of all the others. Then SUM those fields and VISUALIZE the TotalSales field...  Yes WebFOCUS can do that! Yes WebFOCUS can do that! | |||
|
| Expert |
Something like this maybe? SET ASNAMES=ON
DEFINE FILE CAR
SORTFLD/I1=1;
END
TABLE FILE CAR
SUM SALES
BY SORTFLD
BY COUNTRY
ON TABLE HOLD AS DTLHOLD FORMAT ALPHA
END
DEFINE FILE CAR
SORTFLD/I1=2;
DCOUNTRY/A10='TOTAL';
END
TABLE FILE CAR
SUM SALES
BY SORTFLD
BY DCOUNTRY AS COUNTRY
ON TABLE HOLD AS SUMHOLD FORMAT ALPHA
END
TABLE FILE DTLHOLD
SUM SALES
BY SORTFLD SKIP-LINE
BY COUNTRY
ON TABLE SET STYLE *
GRAPHTYPE=DATA,
COLUMN=N3,
GRAPHLOOK=BAR,
$
ENDSTYLE
MORE
FILE SUMHOLD
ENDGinny --------------------------------- Prod: WF 7.7.01 Dev: WF 7.6.9-11 Admin, MRE,self-service; adapters: Teradata, DB2, Oracle, SQL Server, Essbase, ESRI, FlexEnable, Google | |||
|
| Platinum Member |
The easier way out would be what Ginny is suggesting. Build Hold-file-1 with data. Build Hold-file-2 with the total row. Concatenate the 2 with MORE, making the total row a part of the data file. Visualize on this combo hold-file. We have done this a few times and works well. Sandeep Mamidenna ------------------------------------------------------------------------------------------------- Blue Cross & Blue Shield of MS WF.76-10 on (WS2003 + WebSphere) / EDA on z/OS + DB2 + MS-SQL MRE, BID, Dev. Studio, Self-Service apps & a dash of fun !! | |||
|
| Powered by Social Strata |
| Please Wait. Your request is being processed... |
 Read-Only Topic
