January 17, 2020, 03:35 PM
lsteff[SOLVED] Display aggregated field in header of multi-graph in InfoAssist
I am looking for a way to display aggregation in EACH header of a multi-graph chart in InfoAssist. Rather than a SUM or CNT of the total chart results, we would like each section of the multi-graph to SUM or CNT only the results for that section (by the multi-graph field). I have found that:
1. TOTCNT.
2. CNT.
3. SUM.
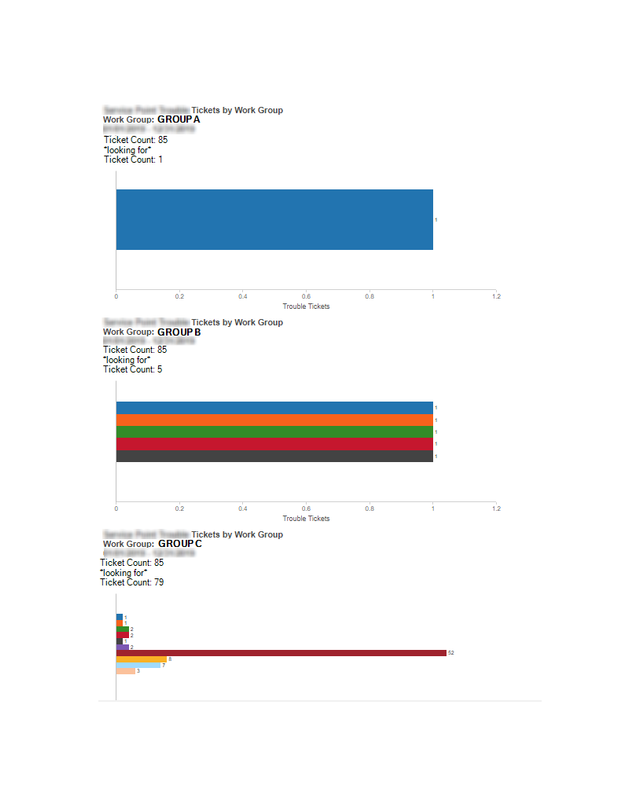
A sample chart would use the following fields, formatted as a horizontal bar multi-graph with color by.
Measure field = CNT.'Tickets'
Multi-graph field = 'Work Group'
Color by field = 'Ticket Status'
sample image:
[IMG:left]
 [/IMG]
 Data
Work Groups: 3 total
Group A, Group B, Group C
Tickets: 85 total
Group A = 1 ticket
Group B = 5 tickets
Group C = 79 tickets
Ticket Status: 10 total
Status 1, Status 2...Status 10
*tickets divided amongst multiple statuses per Work Group; please view image link aboveThis message has been edited. Last edited by: lsteff,
