 |
|||||
|
As of December 1, 2020, Focal Point is retired and repurposed as a reference repository. We value the wealth of knowledge that's been shared here over the years. You'll continue to have access to this treasure trove of knowledge, for search purposes only. Join the TIBCO Community
Former myibi community members should have received an email on 8/3/22 to activate their user accounts to join the community. Check your Spam folder for the email. Please get in touch with us at community@tibco.com for further assistance. Reference the community FAQ to learn more about the community. | |||||
 Read-Only Topic
Go  | Search  | Notify  | Tools  |
| Platinum Member |
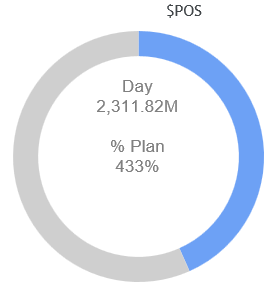
Hi, Looking to get a result like the image below but not sure how to go about it. Tried PIE Ring chart but not sure how to change the Total label in the center just like below. Thanks for the help in advance.  This message has been edited. Last edited by: <Emily McAllister>, This message has been edited. Last edited by: <Emily McAllister>, WebFOCUS 8202M | ||
|
| Master |
My company blocks dropbox, so images will not come through you might of posted on it. Try using a 3rd party like cloudinary.com. They even blocked tinypic.com. - FOCUS Man, just FOCUS! ----------------------------- Product: WebFOCUS Version: 8.1.04 Server: Windows 2008 Server | |||
|
| Member |
I cant see the image.Please post it. WebFOCUS 8 Windows, All Outputs | |||
|
| Expert |
Check out this sharing post from Porter on "Donut" charts - link to post T
| |||||||||
|
| Expert |
Managed to get this using the "numberFormat" setting for "totalLabel". If you are careful with the prefix and suffix attributes, then you can achieve something close to what you want. It might behave in a weird manner when you resize though, so ensure that you design the content with that in mind. I'm actually using a variable to display the percentage but the chart is not displaying the decimal point! Probably because I'm using it in a manner not intended!! I'll post the sample code when IE-EDGE behaves!! T 
| |||||||||
|
| Expert |
This is the relevant section of code to be placed within the WF style sheet. *GRAPH_JS
-*riserBevel of none makes the chart 2D delivering the flat look
"riserBevel":"none",
-*The holeSize property of a % will maintain the pie radius proportion no matter what size your chart is. This is better than using a fixed number of pixels
pieProperties: {
holeSize: '80%',
totalLabel: {visible: true,
font: '10pt Arial',
color: '#808080',
numberFormat: {mode: 'numeric',
thousandSep: ',',
decimalSep: '.',
decimalPlaces: 2,
grouping: 'M', // One of 'K', 'M', 'B', 'T'
prefix: '<center>Day<br />', // added to the front of the label
suffix: '<br /><br />% Plan<br />&MYPCENT.EVAL</center>', // added to the end of the label
}
}
}
*ENDT
| |||||||||
|
| Master |
 - FOCUS Man, just FOCUS! ----------------------------- Product: WebFOCUS Version: 8.1.04 Server: Windows 2008 Server | |||
|
| Platinum Member |
you guys are awesome. Sorry for the late reply as I was out sick WebFOCUS 8202M | |||
|
| Expert |
Hope you're well recovered T
| |||||||||
|
| Powered by Social Strata |
| Please Wait. Your request is being processed... |
 Read-Only Topic
