 |
|||||
|
As of December 1, 2020, Focal Point is retired and repurposed as a reference repository. We value the wealth of knowledge that's been shared here over the years. You'll continue to have access to this treasure trove of knowledge, for search purposes only. Join the TIBCO Community
Former myibi community members should have received an email on 8/3/22 to activate their user accounts to join the community. Check your Spam folder for the email. Please get in touch with us at community@tibco.com for further assistance. Reference the community FAQ to learn more about the community. | |||||
 Focal Point Forums
  WebFOCUS/FOCUS Forum on Focal Point
  [CLOSED] Is there a way to get a Graph Color like this?/
 Read-Only Topic
Go  | Search  | Notify  | Tools  |
| Platinum Member |
I have requirement saying for a bar graph, A and B. Where A should have red color and B should have a color like chess board(Black and white). Is there any option to get this kind of mix color white and black. Please help me. Thanks.This message has been edited. Last edited by: FP Mod Chuck, | ||
|
| Expert |
Probably not, but what output format are you using ? Waz...
| |||||||||||||||||||||||||||
| ||||||||||||||||||||||||||||
| Expert |
The only way to do this that I can think of is to use a repeating background image, but I don't think WebFOCUS graphs can handle this. Francis Give me code, or give me retirement. In FOCUS since 1991 Production: WF 7.7.05M, Dev Studio, BID, MRE, WebSphere, DB2 / Test: WF 8.1.05M, App Studio, BI Portal, Report Caster, jQuery, HighCharts, Apache Tomcat, MS SQL Server | |||
|
| Platinum Member |
Thanks for the reply guys. By the way, The report output type is HTML!!! | |||
|
| Guru |
Can you post a sample? Fernando Prod WF 8.1.04, QA WF 8.2.03, Dev WF 8.2.03 | |||
|
| Master |
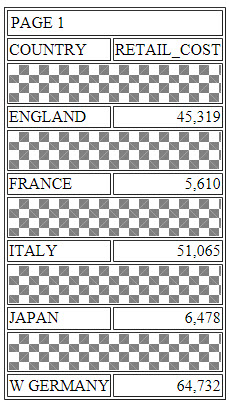
The following fex...
TABLE FILE CAR
 SUM RCOST BY COUNTRY
 ON COUNTRY SUBHEAD
 "  "
 "  "
 ON TABLE HOLD AS CHECKME FORMAT HTMTABLE
ON TABLE SET STYLE *
 TYPE=SUBHEAD, CLASS=clsCheckerboard,$
ENDSTYLE
END
-RUN
-HTMLFORM BEGIN
<!DOCTYPE html>
<html>
<head>
<meta charset="UTF-8">
<title>Title of the document</title>
<style type="text/css" media="screen, print, projection">
 .clsCheckerboard {
  background-image: linear-gradient(45deg, #808080 25%, transparent 25%),
                    linear-gradient(-45deg, #808080 25%, transparent 25%),
		    linear-gradient(45deg, transparent 75%, #808080 75%),
		    linear-gradient(-45deg, transparent 75%, #808080 75%);
  background-size: 20px 20px;
  background-position: 0 0, 0 10px, 10px -10px, -10px 0px;
}
</style>
</head>
<body>
 !IBI.FIL.CHECKME;
</body>
</html>
-HTMLFORM END
gives:  I found the CSS at: http://stackoverflow.com/quest...checkerboard-pattern I don't think you can assign CSS classes to components of a JSCHART, like you can to HTML table reports, but if you could, this may assist. The HTML5 JSCHART manual talks about being able to assign linear gradient properties, for objects like the risers, within the JSON methods/properties section of the StyleSheet. You might want to check this section out. Curious about the business case. Are you looking to help out folks who might have color vision deficiencies?This message has been edited. Last edited by: David Briars, | |||
|
| Platinum Member |
This does what you want, unfortunately, the squares are very small.
GRAPH FILE ibisamp/ggsales
   SUM UNITS
       BUDUNITS
ACROSS REGION AS ''
ON GRAPH SET GRAPHSTYLE *
setFillType(getSeries(0), 3);
setTextureDisplayMode(getSeries(0),0);
setTextureURL(getSeries(0),"\tdg\graphics\pattern_14.gif");
ENDSTYLE
END
The pattern_14.gif file is located here: ibi\WebFOCUS81\ibi_html\javaassist\tdg\graphics\pattern_14.gif so you could put another .gif file  there with larger squares. there with larger squares. Or it would probably be more convenient to locate it in an app folder and reference it this way:
GRAPH FILE ibisamp/ggsales
   SUM UNITS
       BUDUNITS
ACROSS REGION AS ''
ON GRAPH SET GRAPHSTYLE *
setFillType(getSeries(0), 3);
setTextureDisplayMode(getSeries(0),0);
setTextureURL(getSeries(0),"..\..\..\apps\baseapp\checker.gif");
ENDSTYLE
END
WebFOCUS 8.2.06 | |||
|
| Platinum Member |
Thanks for the help guys..I try these!! | |||
|
| Master |
Yep, for sure, if there isn't a requirement for the WF8 HTML5 JSCHART format, take a look at using the legacy API Graphics format. Tried the setTextureURL method just now, and it worked great. :-)This message has been edited. Last edited by: David Briars, | |||
|
| Expert |
I would also suggest that if you can create this in the legacy format, then it should keep working, even after IBI change the charting engine from Threedgraphics to D3 Waz...
| |||||||||||||||||||||||||||
| ||||||||||||||||||||||||||||
| Powered by Social Strata |
| Please Wait. Your request is being processed... |
 Read-Only Topic
 Focal Point Forums
  WebFOCUS/FOCUS Forum on Focal Point
  [CLOSED] Is there a way to get a Graph Color like this?/
