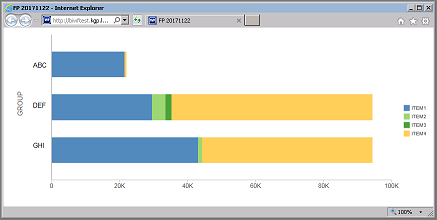
I'm just looking for a way to change the text for the "on hover" display for each of the "ITEM#" segments as they have different meanings within each of the three groups. The issue is that the displayed text is the GROUP, not the associated ITEM#. I can incorporate text for each GROUP/ITEM# if that helps. I'm phishing here.
 Example:
          ITEM1     ITEM2     ITEM3     ITEM4
GROUP 1:  <30       31-60     60-90     >90
GROUP 2:  <100      100-500   501-750   >750
GROUP 3:  Grapes    Apples    Oranges   Bananas
I do the following (simplistic code and not the real code. I'll post the real code if needed.):
GRAPH FILE GRFNMBRS
SUM ITEM1 ITEM2 ITEM3 ITEM4
BY ORDER BY GROUP
-* This goes into a
-* "blaProperties": { "seriesLayout": "stacked", "orientation": "horizontal"},
-* "agnosticSettings": {"chartTypeFullName": "Bar_Stacked_Horizontal"}
-* *END
Thanks in Advance, DougThis message has been edited. Last edited by: FP Mod Chuck,
In FOCUS Since 1983 ~ from FOCUS to WebFOCUS. Current: WebFOCUS Administrator at FIS Worldpay | 8204, 8206
November 22, 2017, 04:58 PM
MartinY
Hi Doug,
Here a some code that I have to accomplish what I think you need. You can't run it as is since I copy paste my code and it's not from the CAR file but you will see the technic. I found the technic reading "Creating HTML5 Charts With WebFOCUS" pdf file.
GRAPH FILE GRAPHDATA
SUM VAR  AS 'Variance'
    COMPUTE DIMX      /A30V = &BY2;
    COMPUTE VARX      /A30V = FPRINT(VAR, 'P19C', 'A25V') || ' &VTYPE.EVAL';
    COMPUTE VAR_PCTX  /A20V = LJUST(12, FPRINT(VAR_PCT, 'P10.2C', 'A12V'), 'A12V') || ' %';
    &BY2
BY &BY1  AS '&BY2T.EVAL'

-IF &HEAD EQ '_FOC_NULL' THEN GOTO NOHEAD;
HEADING
"&HEAD"
-NOHEAD
ON GRAPH PCHOLD FORMAT JSCHART
ON GRAPH SET VZERO OFF
ON GRAPH SET GRWIDTH 1
ON GRAPH SET UNITS &WF_STYLE_UNITS
ON GRAPH SET HAXIS &WF_STYLE_WIDTH
ON GRAPH SET VAXIS &WF_STYLE_HEIGHT
ON GRAPH SET LOOKGRAPH BAR
ON GRAPH SET AUTOFIT ON
ON GRAPH SET STYLE *
*GRAPH_SCRIPT
setPieDepth(0);
setPieTilt(0);
setDepthRadius(0);
setCurveFitEquationDisplay(false);
setPlace(true);
*END
INCLUDE=IBFS:/FILE/IBI_HTML_DIR/ibi_themes/Warm.sty,$
DEFMACRO=INCR_VAL, MACTYPE=RULE, WHEN=VAR GT 0, $
DEFMACRO=DECR_VAL, MACTYPE=RULE, WHEN=VAR LT 0, $
TYPE=REPORT, TITLETEXT=&WF_TITLE.QUOTEDSTRING, $
TYPE=HEADING, JUSTIFY=CENTER, $
TYPE=HEADING, LINE=1, ITEM=1, OBJECT=TEXT, FONT='TIMES NEW ROMAN', SIZE=10, COLOR=RGB(32 0 32), STYLE=NORMAL, $
TYPE=DATA, COLUMN=VAR, MACRO=INCR_VAL, COLOR=RGB(160 0 0), $
TYPE=DATA, COLUMN=VAR, MACRO=DECR_VAL, COLOR=RGB(8 97 74), $
TYPE=DATA, COLUMN=&BY1, BUCKET=x-axis, $
TYPE=DATA, COLUMN=VAR, BUCKET=y-axis, $
TYPE=DATA, COLUMN=DIMX,     BUCKET=tooltip, $
TYPE=DATA, COLUMN=VARX,     BUCKET=tooltip, $
TYPE=DATA, COLUMN=VAR_PCTX, BUCKET=tooltip, $
*GRAPH_JS_FINAL
series: [ {"series": 'reset', "tooltip": '{{tooltip1}}<br>{{tooltip2}}<br>{{tooltip3}}'} ],
htmlToolTip: {enable: true, snap: false }
*END
*GRAPH_SCRIPT
setReportParsingErrors(false);
setSelectionEnableMove(false);
setFillColor(getSeries(*),new Color(8,97,74));
setDisplay(getY1Title(),false);
setDisplay(getY1Label(),false);
setDisplay(getY1AxisLine(),false);
setLabelStagger(getO1Label(),true);
-* 45deg
setTextRotation(getO1Label(),3);
*END

*GRAPH_JS_FINAL
"xaxis": {
    "title": {"visible": false}
},
"yaxis": {
    "title": {"visible": false},
    "majorGrid": {"ticks": {"visible": false}}
}
*END
ENDSTYLE
END
WF versions : Prod 8.2.04M gen 33, Dev 8.2.04M gen 33, OS : Windows, DB : MSSQL, Outputs : HTML, Excel, PDF In Focus since 2007