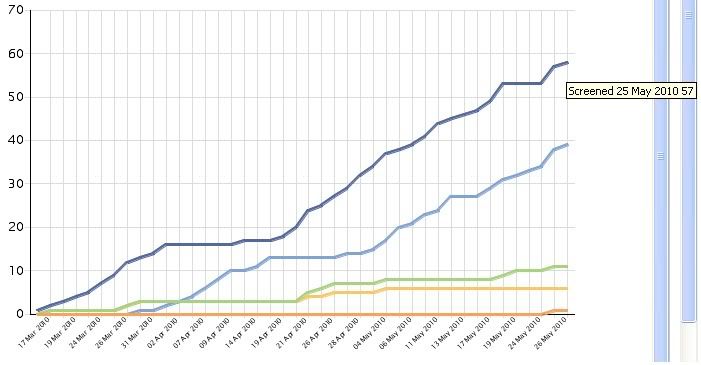
Hopefully, this is just something little I am missing. I have a line graph with 5 lines over a date range. The dates on the graph don't line up with the data on the graph. The toot tip shows the data "Screened 25 May 2010 57", but that tool tip should be showing the data from 26 May. http://i855.photobucket.com/al...rnell/line_graph.jpg The code is here:
GRAPH FILE SUBJECTS
SUM COMPUTE NUMSCR/I10 = LAST NUMSCR + NUM_SCR; AS 'Screened'
	COMPUTE NUMSF/I10 = LAST NUMSF + NUM_SF; AS 'Screen Failed'
	COMPUTE NUMRAND/I10 = LAST NUMRAND + NUM_RAND; AS 'Randomized'
	COMPUTE NUMDISCON/I10 = LAST NUMDISCON + NUM_DISCON; AS 'Withdrawn'
	COMPUTE NUMCOMP/I10 = LAST NUMCOMP + NUM_COMP; AS 'Completed'
ACROSS FMT_EVENT_DM
WHERE EVENT_DM GE '&NEWFROMDATE';
WHERE EVENT_DM LE '&NEWTODATE';
ON GRAPH HOLD AS SUBGR FORMAT HTMTABLE
ON GRAPH SET UNITS PIXELS
ON GRAPH SET LOOKGRAPH VLINE
ON GRAPH SET GRAPHEDIT SERVER
ON GRAPH SET BARNUMB OFF
ON GRAPH SET 3D OFF
ON GRAPH SET VZERO ON
ON GRAPH SET GRID ON
ON GRAPH SET VAXIS &VAXISS
ON GRAPH SET HAXIS &HAXISS
ON GRAPH SET GRAPHSTYLE *
setFillColor(getSeries(0), new Color(82,104,161));
setFillColor(getSeries(1), new Color(254,197,101));
setFillColor(getSeries(2), new Color(127,163,214));
setFillColor(getSeries(3), new Color(167,211,125));
setFillColor(getSeries(4), new Color(249,161,94));
setBorderColor(getSeries(0), new Color (82,104,161));
setBorderColor(getSeries(1), new Color (254,197,101));
setBorderColor(getSeries(2), new Color (127,163,214));
setBorderColor(getSeries(3), new Color (167,211,125));
setBorderColor(getSeries(4), new Color (249,161,94));
setSeriesLineWidthDefault(2);
setO1TitleString("");
setO1LabelAutoSkip(2);
setO1LabelSkipBegin(1);
setO1LabelSkipCount(1);
setO1LabelRotate(3);
setFrameDisplay(false);
setTextString(getY1Title(),"");
setDisplay(getY1Title(),true);
setY1LabelDisplay(true);
setMarkerDisplay(false);
setPlaceSkip(getO1Label(), 0);
setO1MajorGridDisplay(true);
setO1MinorGridDisplay(false);
setO1MajorGridStyle(1);
setY1MajorGridDisplay(true);
setY1MinorGridDisplay(false);
setY1MajorGridStyle(1);
setBorderColor(getY1MajorGrid(), new Color (220,220,220));
setBorderColor(getO1MajorGrid(), new Color (220,220,220));
setFontSizeAbsolute(getY1Title(),true);
setFontSizeAbsolute(getY1Label(),true);
setFontSizeAbsolute(getY2Title(),true);
setFontSizeAbsolute(getY2Label(),true);
setFontSizeAbsolute(getO1Title(),true);
setLegendDisplay(&TRUEFALSE);
setFillMissingData(0);
setPlace(true);
ENDSTYLE
ON GRAPH SET STYLE *
     SQUEEZE=ON,
     ORIENTATION=PORTRAIT,
$
TYPE=REPORT,
     GRID=OFF,
     FONT='VERDANA',
     SIZE=9,
$
ENDSTYLE
END
Any help would be appreciated. ThanksThis message has been edited. Last edited by: Kerry,
WebFOCUS 7.6.8 Linux HTML,AHTML,PDF
May 21, 2010, 08:23 PM
Doug
Hey Cody,
Do you know what would be really great? A sample using a standard IBI file. I have some thoughts on this but not the time to re-create a possible error especially when I'm not sure about your data.
So, would you be so kind as to provide a sample of this using a file from ibisamp?
I'd be glad to help...
In FOCUS Since 1983 ~ from FOCUS to WebFOCUS. Current: WebFOCUS Administrator at FIS Worldpay | 8204, 8206
May 23, 2010, 05:52 PM
Waz
What I think would be interesting to see is the HTM file generated, this is the one that is created in the background to generate the image.
It will have in it all the parameters that go into the call to the graph engine Threedgraphics.
Waz...
Prod:
WebFOCUS 7.6.10/8.1.04
Upgrade:
WebFOCUS 8.2.07
OS:
Linux
Outputs:
HTML, PDF, Excel, PPT
In Focus since 1984
Pity the lost knowledge of an old programmer!
May 24, 2010, 01:50 PM
Cody
Hi Doug,
Here is the same report using the sales file. Pretty sure that is a standard file (SALES). Same results. I also created it as a table to make sure the values were being added up properly, which they were.
Examining it more, it looks like the final value is getting plotted, but the tooltip is not working on it?
GRAPH FILE SALES
SUM COMPUTE TOTDEL/I10 = LAST TOTDEL + DELIVER_AMT;
	DELIVER_AMT
	COMPUTE TOTOPEN/I10 = LAST TOTOPEN + OPENING_AMT;
	OPENING_AMT
ACROSS DATE
ON GRAPH PCHOLD FORMAT HTML
ON GRAPH SET UNITS PIXELS
ON GRAPH SET LOOKGRAPH VLINE
ON GRAPH SET GRAPHEDIT SERVER
ON GRAPH SET BARNUMB OFF
ON GRAPH SET 3D OFF
ON GRAPH SET VZERO ON
ON GRAPH SET GRID ON
ON GRAPH SET VAXIS 400
ON GRAPH SET HAXIS 500
ON GRAPH SET GRAPHSTYLE *
setFillColor(getSeries(0), new Color(82,104,161));
setFillColor(getSeries(1), new Color(254,197,101));
setFillColor(getSeries(2), new Color(127,163,214));
setFillColor(getSeries(3), new Color(167,211,125));
setFillColor(getSeries(4), new Color(249,161,94));
setBorderColor(getSeries(0), new Color (82,104,161));
setBorderColor(getSeries(1), new Color (254,197,101));
setBorderColor(getSeries(2), new Color (127,163,214));
setBorderColor(getSeries(3), new Color (167,211,125));
setBorderColor(getSeries(4), new Color (249,161,94));
setSeriesLineWidthDefault(2);
setO1TitleString("");
setO1LabelAutoSkip(2);
setO1LabelSkipBegin(1);
setO1LabelSkipCount(1);
setO1LabelRotate(3);
setFrameDisplay(false);
setTextString(getY1Title(),"");
setDisplay(getY1Title(),true);
setY1LabelDisplay(true);
setMarkerDisplay(false);
setPlaceSkip(getO1Label(), 0);
setO1MajorGridDisplay(true);
setO1MinorGridDisplay(false);
setO1MajorGridStyle(1);
setY1MajorGridDisplay(true);
setY1MinorGridDisplay(false);
setY1MajorGridStyle(1);
setBorderColor(getY1MajorGrid(), new Color (220,220,220));
setBorderColor(getO1MajorGrid(), new Color (220,220,220));
setFontSizeAbsolute(getY1Title(),true);
setFontSizeAbsolute(getY1Label(),true);
setFontSizeAbsolute(getY2Title(),true);
setFontSizeAbsolute(getY2Label(),true);
setFontSizeAbsolute(getO1Title(),true);
setLegendDisplay(true);
setFillMissingData(0);
setPlace(true);
ENDSTYLE
ON GRAPH SET STYLE *
     SQUEEZE=ON,
     ORIENTATION=PORTRAIT,
$
TYPE=REPORT,
     GRID=OFF,
     FONT='VERDANA',
     SIZE=9,
$
ENDSTYLE
END
Thanks for looking
WebFOCUS 7.6.8 Linux HTML,AHTML,PDF
May 24, 2010, 01:53 PM
Cody
Hi Waz, Here is the HTM (view source) that got generated from the example using the SALES file
I read over the troubleshooting tip, but it doesn't seem to solve the problem as there is (should be) a value for the last point. Luckily this is just a demo system at the moment so this issue is not urgent. I will have to look into it more in the future.