 |
|||||
|
As of December 1, 2020, Focal Point is retired and repurposed as a reference repository. We value the wealth of knowledge that's been shared here over the years. You'll continue to have access to this treasure trove of knowledge, for search purposes only. Join the TIBCO Community
Former myibi community members should have received an email on 8/3/22 to activate their user accounts to join the community. Check your Spam folder for the email. Please get in touch with us at community@tibco.com for further assistance. Reference the community FAQ to learn more about the community. | |||||
 WebFOCUS/FOCUS Forum on Focal Point Read-Only Topic
Go | Search | Notify | Tools |
| [CASE OPENED] (FOC32451) Max of 255 across instances in online report exceeded | Login/Join |
| Virtuoso |
I have a graph here with temperature on the X-axis and pressure on the Y-axis for several part numbers. I'm running into the above error... The graph is defined as: GRAPH FILE DATA -* Initially Created by Advanced Graph Assistant PRINT 'E''' AS 'E'' (MPa)' BY 'PART_NO' AS 'Part no.' ACROSS 'T' AS 'T (°C)' ON GRAPH SET HAXIS 19 ON GRAPH SET VAXIS 12 ON GRAPH SET UNITS CM ON GRAPH SET LOOKGRAPH SCATTERS ON GRAPH SET GRMERGE ADVANCED ON GRAPH SET GRMULTIGRAPH 0 ON GRAPH SET GRLEGEND 1 ON GRAPH SET GRXAXIS 1 ON GRAPH SET GRAPHSTYLE * setLogScale(getY1Axis(),true); setConnectScatterMarkers(true); setScaleMinAuto(getX1Axis(),false); setScaleMin(getX1Axis(),-100.0); setScaleMaxAuto(getX1Axis(),false); setScaleMax(getX1Axis(),100.0); setX1MajorGridStep(20.0); ENDSTYLE END Is there a way to tune that limit on ACROSS up (I'm not going over 255 by much) or is there a way to turn that ACROSS into a BY and keep the grouping by part no. for the legend? The Y-axis is logarithmic, I don't think I can easily swap the series around to the other axis?This message has been edited. Last edited by: Wep5622, WebFOCUS 8.1.03, Windows 7-64/2008-64, IBM DB2/400, Oracle 11g & RDB, MS SQL-Server 2005, SAP, PostgreSQL 11, Output: HTML, PDF, Excel 2010 : Member of User Group Benelux : | ||
|
| Expert |
? 32451 0(FOC32451) Max of 255 across instances in online report exceeded This limit does not apply to HOLD files. Consider generating a HOLD file instead. Tom Flynn WebFOCUS 8.1.05 - PROD/QA DB2 - AS400 - Mainframe | |||
|
| Virtuoso |
I can't, this is for a GRAPH request. PRINT --> Y-axis ACROSS --> X-axis BY --> Legend I tried with two BY-fields, but either way around doesn't result in the desired graph. I know of one workaround, which is to:
There has to be a simpler approach!This message has been edited. Last edited by: Wep5622, WebFOCUS 8.1.03, Windows 7-64/2008-64, IBM DB2/400, Oracle 11g & RDB, MS SQL-Server 2005, SAP, PostgreSQL 11, Output: HTML, PDF, Excel 2010 : Member of User Group Benelux : | |||
|
| Virtuoso |
Perhaps I didn't put enough emphasis on the fact that this graph has an X-axis, as opposed to an Ordinal axis. There is a distinct difference between those two, namely: "An ordinal axis is a type of axis in which the actual values of the points are not significant and not used." I am NOT using an ordinal axis. The actual values of the points on our X-axis matter and they have enough precision that we can have any number of different values on that axis, although they are all in a range of -100 to 100. A limit of 255 values is preposterous in our case. WebFOCUS 8.1.03, Windows 7-64/2008-64, IBM DB2/400, Oracle 11g & RDB, MS SQL-Server 2005, SAP, PostgreSQL 11, Output: HTML, PDF, Excel 2010 : Member of User Group Benelux : | |||
|
| Virtuoso |
Nobody knows the answer? WebFOCUS 8.1.03, Windows 7-64/2008-64, IBM DB2/400, Oracle 11g & RDB, MS SQL-Server 2005, SAP, PostgreSQL 11, Output: HTML, PDF, Excel 2010 : Member of User Group Benelux : | |||
|
| Expert |
There's always the old method of extracting the data into save files and then including them within the graphstyle syntax such as within this post by JG. T
| |||||||||
|
| Virtuoso |
My recollection is that your could change ACROSS to BY, and still force the desired graph type by means of explicit ON GRAPH SET specifications. Try it. | |||
|
| Virtuoso |
Yes, and I have used that in the past. However, in this case it changes the graph! Instead of multiple curves per PART_NO I get a single line that follows X==Y. The only reason the remaining line is curved seems to be the logarithmic scale of my Y-axis. Too bad we can't upload images to this forum or I'd post the results of both versions. WebFOCUS 8.1.03, Windows 7-64/2008-64, IBM DB2/400, Oracle 11g & RDB, MS SQL-Server 2005, SAP, PostgreSQL 11, Output: HTML, PDF, Excel 2010 : Member of User Group Benelux : | |||
|
| Virtuoso |
Save your image an a public website (e.g. webshots or minus) and post the link. Daniel In Focus since 1982 wf 8.202M/Win10/IIS/SSA - WrapApp Front End for WF | |||
|
| Virtuoso |
I opened a case with IBI instead, as the images are not supposed to be publicly available. WebFOCUS 8.1.03, Windows 7-64/2008-64, IBM DB2/400, Oracle 11g & RDB, MS SQL-Server 2005, SAP, PostgreSQL 11, Output: HTML, PDF, Excel 2010 : Member of User Group Benelux : | |||
|
| Expert |
To demonstrate what Wep infers, use this code. Wep, if this code doesn't show the difference that you mean please let me know and I'll delete it DEFINE FILE GGSALES
XAXIS/D5 = INT(DOLLARS / 90) - 150;
YAXIS/D5 = INT(BUDDOLLARS / 100);
END
GRAPH FILE GGSALES
PRINT YAXIS
BY PRODUCT
ACROSS XAXIS
WHERE PRODUCT IN ('Capuccino','Espresso','Latte')
-*ON GRAPH SET GRAPHEDIT OFF
ON GRAPH SET HAXIS 950
ON GRAPH SET VAXIS 600
ON GRAPH SET UNITS CM
ON GRAPH SET LOOKGRAPH SCATTERS
ON GRAPH SET GRMERGE ADVANCED
ON GRAPH SET GRMULTIGRAPH 0
ON GRAPH SET GRLEGEND 1
ON GRAPH SET GRXAXIS 1
ON GRAPH SET GRAPHSTYLE *
setTextString(getTitle(),"X Axis as Across");
setDisplay(getTitle(),true);
setLogScale(getY1Axis(),true);
setConnectScatterMarkers(true);
setScaleMinAuto(getX1Axis(),false);
setScaleMin(getX1Axis(),-100.0);
setScaleMaxAuto(getX1Axis(),false);
setScaleMax(getX1Axis(),100.0);
setX1MajorGridStep(20.0);
ENDSTYLE
ENDI'll publish the images as well soon. T
| |||||||||
|
| Expert |
Images - 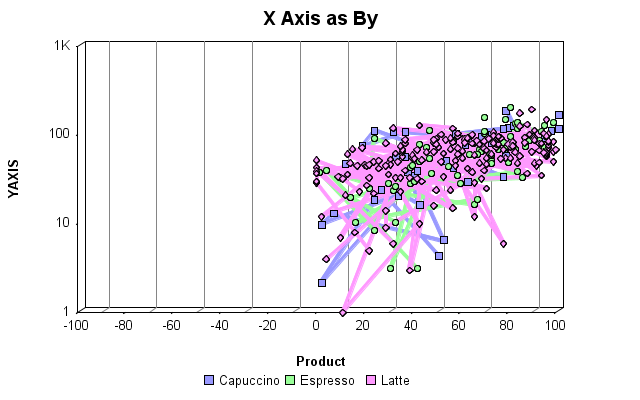 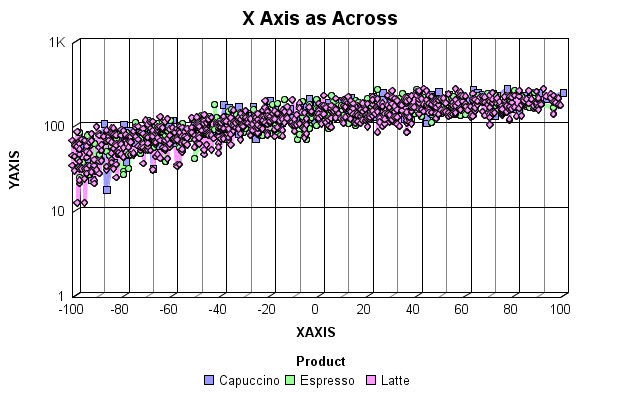 T
| |||||||||
|
| Virtuoso |
Yes Tony, I think that's pretty similar to what I'm seeing. Everything ends up at the positive side of the X-axis, at least, same as in my case. I also seemed to see a strong correlation between values on both axis; if not displayed on a logarithmic Y-scale it was almost a straight line! There were some odd discrepancies in that line though: sometimes the lines between 3 subsequent points formed a 90 degree angle. I'm not sure how much of what I witnessed was due to our particular data. I'm curious, if you put that on a linear Y-scale, what would it look like? I'd try myself, but we removed (among others) the GGSALES sample file from our installation. There's probably some way to "re-install" it. I recall we did that for the CAR database, but I can't recall how and searching the forums doesn't yield the answer... WebFOCUS 8.1.03, Windows 7-64/2008-64, IBM DB2/400, Oracle 11g & RDB, MS SQL-Server 2005, SAP, PostgreSQL 11, Output: HTML, PDF, Excel 2010 : Member of User Group Benelux : | |||
|
| Expert |
Like this - 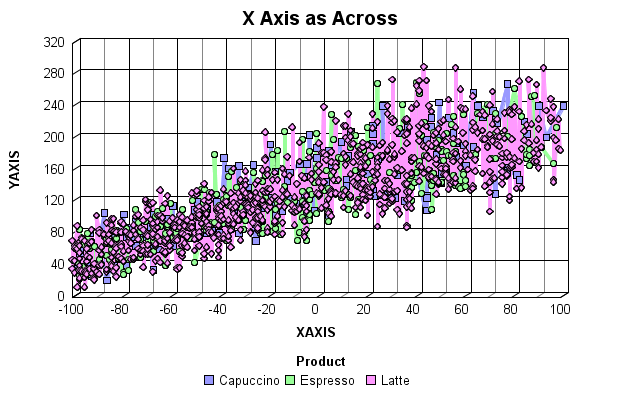 PM coming your way regarding the GGSALES DB T
| |||||||||
|
| Powered by Social Strata |
| Please Wait. Your request is being processed... |
Read-Only Topic WebFOCUS/FOCUS Forum on Focal Point | View $GS_USERNAME's Public Profile | |
| Add $GS_USERNAME to my Ignore List | |
| View Recent Posts by $GS_USERNAME | |
| Notify me of New Posts by $GS_USERNAME |