 |
|||||
|
As of December 1, 2020, Focal Point is retired and repurposed as a reference repository. We value the wealth of knowledge that's been shared here over the years. You'll continue to have access to this treasure trove of knowledge, for search purposes only. Join the TIBCO Community
Former myibi community members should have received an email on 8/3/22 to activate their user accounts to join the community. Check your Spam folder for the email. Please get in touch with us at community@tibco.com for further assistance. Reference the community FAQ to learn more about the community. | |||||
 Read-Only Topic
Go | Search | Notify | Tools |
| [CLOSED] Line Graph Issue | Login/Join |
| Silver Member |
Hopefully, this is just something little I am missing. I have a line graph with 5 lines over a date range. The dates on the graph don't line up with the data on the graph. The toot tip shows the data "Screened 25 May 2010 57", but that tool tip should be showing the data from 26 May. http://i855.photobucket.com/al...rnell/line_graph.jpg 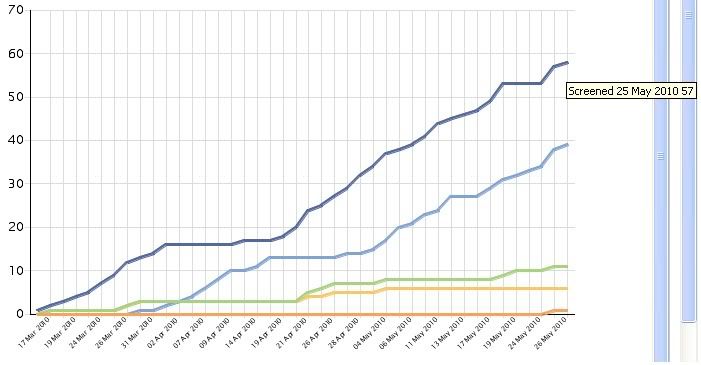 The code is here:
GRAPH FILE SUBJECTS
SUM COMPUTE NUMSCR/I10 = LAST NUMSCR + NUM_SCR; AS 'Screened'
	COMPUTE NUMSF/I10 = LAST NUMSF + NUM_SF; AS 'Screen Failed'
	COMPUTE NUMRAND/I10 = LAST NUMRAND + NUM_RAND; AS 'Randomized'
	COMPUTE NUMDISCON/I10 = LAST NUMDISCON + NUM_DISCON; AS 'Withdrawn'
	COMPUTE NUMCOMP/I10 = LAST NUMCOMP + NUM_COMP; AS 'Completed'
ACROSS FMT_EVENT_DM
WHERE EVENT_DM GE '&NEWFROMDATE';
WHERE EVENT_DM LE '&NEWTODATE';
ON GRAPH HOLD AS SUBGR FORMAT HTMTABLE
ON GRAPH SET UNITS PIXELS
ON GRAPH SET LOOKGRAPH VLINE
ON GRAPH SET GRAPHEDIT SERVER
ON GRAPH SET BARNUMB OFF
ON GRAPH SET 3D OFF
ON GRAPH SET VZERO ON
ON GRAPH SET GRID ON
ON GRAPH SET VAXIS &VAXISS
ON GRAPH SET HAXIS &HAXISS
ON GRAPH SET GRAPHSTYLE *
setFillColor(getSeries(0), new Color(82,104,161));
setFillColor(getSeries(1), new Color(254,197,101));
setFillColor(getSeries(2), new Color(127,163,214));
setFillColor(getSeries(3), new Color(167,211,125));
setFillColor(getSeries(4), new Color(249,161,94));
setBorderColor(getSeries(0), new Color (82,104,161));
setBorderColor(getSeries(1), new Color (254,197,101));
setBorderColor(getSeries(2), new Color (127,163,214));
setBorderColor(getSeries(3), new Color (167,211,125));
setBorderColor(getSeries(4), new Color (249,161,94));
setSeriesLineWidthDefault(2);
setO1TitleString("");
setO1LabelAutoSkip(2);
setO1LabelSkipBegin(1);
setO1LabelSkipCount(1);
setO1LabelRotate(3);
setFrameDisplay(false);
setTextString(getY1Title(),"");
setDisplay(getY1Title(),true);
setY1LabelDisplay(true);
setMarkerDisplay(false);
setPlaceSkip(getO1Label(), 0);
setO1MajorGridDisplay(true);
setO1MinorGridDisplay(false);
setO1MajorGridStyle(1);
setY1MajorGridDisplay(true);
setY1MinorGridDisplay(false);
setY1MajorGridStyle(1);
setBorderColor(getY1MajorGrid(), new Color (220,220,220));
setBorderColor(getO1MajorGrid(), new Color (220,220,220));
setFontSizeAbsolute(getY1Title(),true);
setFontSizeAbsolute(getY1Label(),true);
setFontSizeAbsolute(getY2Title(),true);
setFontSizeAbsolute(getY2Label(),true);
setFontSizeAbsolute(getO1Title(),true);
setLegendDisplay(&TRUEFALSE);
setFillMissingData(0);
setPlace(true);
ENDSTYLE
ON GRAPH SET STYLE *
     SQUEEZE=ON,
     ORIENTATION=PORTRAIT,
$
TYPE=REPORT,
     GRID=OFF,
     FONT='VERDANA',
     SIZE=9,
$
ENDSTYLE
END
Any help would be appreciated. ThanksThis message has been edited. Last edited by: Kerry, WebFOCUS 7.6.8 Linux HTML,AHTML,PDF | ||
|
| Expert |
Hey Cody, Do you know what would be really great? A sample using a standard IBI file. I have some thoughts on this but not the time to re-create a possible error especially when I'm not sure about your data. So, would you be so kind as to provide a sample of this using a file from ibisamp? I'd be glad to help...
| |||||
|
| Expert |
What I think would be interesting to see is the HTM file generated, this is the one that is created in the background to generate the image. It will have in it all the parameters that go into the call to the graph engine Threedgraphics. Waz...
| |||||||||||||||||||||||||||
| ||||||||||||||||||||||||||||
| Silver Member |
Hi Doug, Here is the same report using the sales file. Pretty sure that is a standard file (SALES). Same results. I also created it as a table to make sure the values were being added up properly, which they were. Examining it more, it looks like the final value is getting plotted, but the tooltip is not working on it?
GRAPH FILE SALES
SUM COMPUTE TOTDEL/I10 = LAST TOTDEL + DELIVER_AMT;
	DELIVER_AMT
	COMPUTE TOTOPEN/I10 = LAST TOTOPEN + OPENING_AMT;
	OPENING_AMT
ACROSS DATE
ON GRAPH PCHOLD FORMAT HTML
ON GRAPH SET UNITS PIXELS
ON GRAPH SET LOOKGRAPH VLINE
ON GRAPH SET GRAPHEDIT SERVER
ON GRAPH SET BARNUMB OFF
ON GRAPH SET 3D OFF
ON GRAPH SET VZERO ON
ON GRAPH SET GRID ON
ON GRAPH SET VAXIS 400
ON GRAPH SET HAXIS 500
ON GRAPH SET GRAPHSTYLE *
setFillColor(getSeries(0), new Color(82,104,161));
setFillColor(getSeries(1), new Color(254,197,101));
setFillColor(getSeries(2), new Color(127,163,214));
setFillColor(getSeries(3), new Color(167,211,125));
setFillColor(getSeries(4), new Color(249,161,94));
setBorderColor(getSeries(0), new Color (82,104,161));
setBorderColor(getSeries(1), new Color (254,197,101));
setBorderColor(getSeries(2), new Color (127,163,214));
setBorderColor(getSeries(3), new Color (167,211,125));
setBorderColor(getSeries(4), new Color (249,161,94));
setSeriesLineWidthDefault(2);
setO1TitleString("");
setO1LabelAutoSkip(2);
setO1LabelSkipBegin(1);
setO1LabelSkipCount(1);
setO1LabelRotate(3);
setFrameDisplay(false);
setTextString(getY1Title(),"");
setDisplay(getY1Title(),true);
setY1LabelDisplay(true);
setMarkerDisplay(false);
setPlaceSkip(getO1Label(), 0);
setO1MajorGridDisplay(true);
setO1MinorGridDisplay(false);
setO1MajorGridStyle(1);
setY1MajorGridDisplay(true);
setY1MinorGridDisplay(false);
setY1MajorGridStyle(1);
setBorderColor(getY1MajorGrid(), new Color (220,220,220));
setBorderColor(getO1MajorGrid(), new Color (220,220,220));
setFontSizeAbsolute(getY1Title(),true);
setFontSizeAbsolute(getY1Label(),true);
setFontSizeAbsolute(getY2Title(),true);
setFontSizeAbsolute(getY2Label(),true);
setFontSizeAbsolute(getO1Title(),true);
setLegendDisplay(true);
setFillMissingData(0);
setPlace(true);
ENDSTYLE
ON GRAPH SET STYLE *
     SQUEEZE=ON,
     ORIENTATION=PORTRAIT,
$
TYPE=REPORT,
     GRID=OFF,
     FONT='VERDANA',
     SIZE=9,
$
ENDSTYLE
END
Thanks for looking WebFOCUS 7.6.8 Linux HTML,AHTML,PDF | |||
|
| Silver Member |
Hi Waz, Here is the HTM (view source) that got generated from the example using the SALES file <HTML> <HEAD> <TITLE>Powered by WebFOCUS</TITLE> </HEAD> <BODY BGCOLOR="ffffff"> <MAP NAME=hxdwlqdp0> <AREA SHAPE=POLYGON COORDS="308,307,300,301,408,138,416,144,308,307" NAME="OPENING_AMT 1019 30" TITLE="OPENING_AMT 1019 30" NOHREF ALT="OPENING_AMT 1019 30" TABINDEX="59"> <AREA SHAPE=POLYGON COORDS="195,290,197,280,305,299,303,309,195,290" NAME="OPENING_AMT 1018 80" TITLE="OPENING_AMT 1018 80" NOHREF ALT="OPENING_AMT 1018 80" TABINDEX="58"> <AREA SHAPE=POLYGON COORDS="87,261,89,251,197,280,195,290,87,261" NAME="OPENING_AMT 1017 155" TITLE="OPENING_AMT 1017 155" NOHREF ALT="OPENING_AMT 1017 155" TABINDEX="57"> <AREA SHAPE=POLYGON COORDS="308,218,300,212,408,38,416,44,308,218" NAME="TOTOPEN 1019 265" TITLE="TOTOPEN 1019 265" NOHREF ALT="TOTOPEN 1019 265" TABINDEX="56"> <AREA SHAPE=POLYGON COORDS="197,231,195,221,303,210,305,220,197,231" NAME="TOTOPEN 1018 235" TITLE="TOTOPEN 1018 235" NOHREF ALT="TOTOPEN 1018 235" TABINDEX="55"> <AREA SHAPE=POLYGON COORDS="89,261,87,251,195,221,197,231,89,261" NAME="TOTOPEN 1017 155" TITLE="TOTOPEN 1017 155" NOHREF ALT="TOTOPEN 1017 155" TABINDEX="54"> <AREA SHAPE=POLYGON COORDS="308,307,300,301,408,149,416,155,308,307" NAME="DELIVER_AMT 1019 30" TITLE="DELIVER_AMT 1019 30" NOHREF ALT="DELIVER_AMT 1019 30" TABINDEX="53"> <AREA SHAPE=POLYGON COORDS="195,278,197,268,305,299,303,309,195,278" NAME="DELIVER_AMT 1018 110" TITLE="DELIVER_AMT 1018 110" NOHREF ALT="DELIVER_AMT 1018 110" TABINDEX="52"> <AREA SHAPE=POLYGON COORDS="87,248,89,238,197,268,195,278,87,248" NAME="DELIVER_AMT 1017 190" TITLE="DELIVER_AMT 1017 190" NOHREF ALT="DELIVER_AMT 1017 190" TABINDEX="51"> <AREA SHAPE=POLYGON COORDS="308,193,300,187,408,25,416,31,308,193" NAME="TOTDEL 1019 330" TITLE="TOTDEL 1019 330" NOHREF ALT="TOTDEL 1019 330" TABINDEX="50"> <AREA SHAPE=POLYGON COORDS="197,207,195,197,303,185,305,195,197,207" NAME="TOTDEL 1018 300" TITLE="TOTDEL 1018 300" NOHREF ALT="TOTDEL 1018 300" TABINDEX="49"> <AREA SHAPE=POLYGON COORDS="90,248,86,238,194,197,198,207,90,248" NAME="TOTDEL 1017 190" TITLE="TOTDEL 1017 190" NOHREF ALT="TOTDEL 1017 190" TABINDEX="48"> <AREA SHAPE=default NOHREF> </MAP> <IMG SRC="/ibi_apps/WFServlet?&PG_Func=GETBINARY&PG_File=xkrhiosg.png" USEMAP="#hxdwlqdp0" BORDER=0 ALT=""><br> </BODY> </HTML> <!-- 0 NUMBER OF RECORDS IN GRAPH= 19 PLOT POINTS= 4 WebFOCUS Version 7.6.10 compiled and linked on Tue Sep 29 17:06:02 EDT 2009 (Gen branch7610:187) --> Thanks WebFOCUS 7.6.8 Linux HTML,AHTML,PDF | |||
|
| Expert |
If you have noticed, placing the mouse too the left of the line gets the previous values tooltip, and too the right the current one. Looks like the last points only get the previous value. I found this Troubleshoooting item in a search of IBI http://techsupport.information...utions/50092510.html, seems to fit. Waz...
| |||||||||||||||||||||||||||
| ||||||||||||||||||||||||||||
| Silver Member |
Hi Waz, I did notice that about the mouse. I read over the troubleshooting tip, but it doesn't seem to solve the problem as there is (should be) a value for the last point. Luckily this is just a demo system at the moment so this issue is not urgent. I will have to look into it more in the future. Thanks WebFOCUS 7.6.8 Linux HTML,AHTML,PDF | |||
|
| Powered by Social Strata |
| Please Wait. Your request is being processed... |
Read-Only Topic| View $GS_USERNAME's Public Profile | |
| Add $GS_USERNAME to my Ignore List | |
| View Recent Posts by $GS_USERNAME | |
| Notify me of New Posts by $GS_USERNAME |